New bull chart for $30,000 copper price: porphyries nearly mined out
“The previous copper bull market took place between 2001 and 2011 and saw prices rise seven-fold: from $0.60 to $4.62 per pound. The fundamentals today are even more bullish.
“We would not be surprised to see copper prices again advance a minimum of seven-fold before this bull market is over. Using $1.95 as our starting point, we expect copper prices to potentially peak near $15 per pound by the latter part of this decade.”
The rosy demand side for copper has been well documented and Goehring & Rozencwajg focuses on supply, specifically depletion in their latest commentary.
Depletion, surprisingly, is not discussed that often in the industry and according to the authors is little understood, despite its fundamental importance for long-term supply trends.
Low and declining grades, uninspiring green and brownfield discoveries (with a few exceptions) and thin, slow project pipelines have become rules of thumb in the copper mining industry.
To those issues the report adds copper miners’ habit of high-grading (mining your best quality ore first) and growing your reserves with a simple ploy – lowering cut-off grades when prices rise.

Even with prices well above $10,000 a tonne, these paper reserves cannot keep growing according to Goehring & Rozencwajg, specifically at porphyry deposits which produce 80% of the world’s copper.
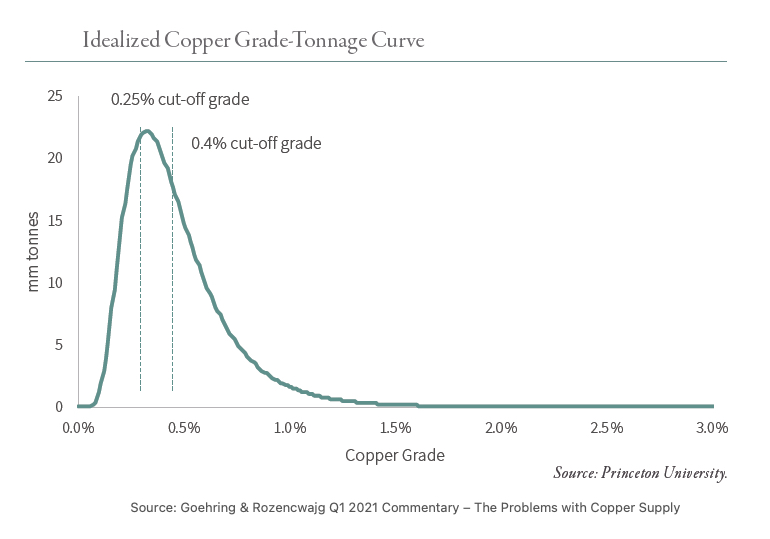
The authors have calculated an industry average cut-off grade of 0.25%, down from 0.4% in the mid-2000s when the firm first started tracking producer’s reserve calculations at 115 mines across the globe responsible for four-fifths of total output.
“The copper industry’s ability to increase its reserve base by lowering its cut-off grade is nearing an end, regardless of how high copper prices go. It is a complicated but very important subject based on how copper porphyry deposits are geologically formed.
“Lowering the cut-off grade clearly cannot go on indefinitely; unlike interest rates there is a firm low at zero. More important, the log-normal shape of the grade-tonnage plot means that most of the reserves have likely already been added.
“Most reserves are located on the right side of the mean where the grade-tonnage curve has a long tail. On the left hand side of the mean, the log-normal distribution shows that the grade-tonnage curve has a very short tail with far few reserves.”
Click here to take a deep dive at Goehring & Rozencwajg.


