Momentum in the stock market is building toward a breakout
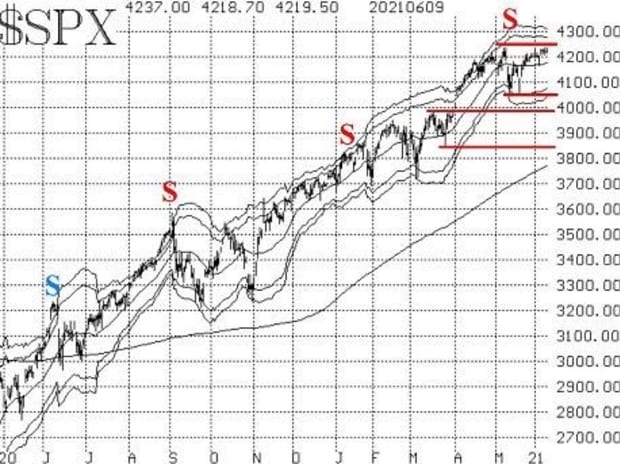
The stock market, as measured by the S&P 500 Index SPX,
SPX has had a daily high very near that level for four days in a row, and for seven times in the last month. Internal indicators are improving, but unless the most important indicator — price — can confirm, we are not aggressively buying.
A breakout to new all-time highs, on a two-day closing basis (i.e., SPX must close at a new high above 4238 for two days in a row) would be a major development and would require the addition of long positions.
However, as long as this resistance holds, the bears have a fighting chance to knock the market back down to the low end of its now-two-month-long trading rage: 4060. Below that, there is support at 4000 and 3870, but for now the 4060 area is important because if it gives way, that would be a major, negative disappointment.

Ironically, the SPDR S&P 500 ETF Trust SPY,
For the record, the McMillan Volatility Band (MVB) sell signal of May 11 is still in effect.
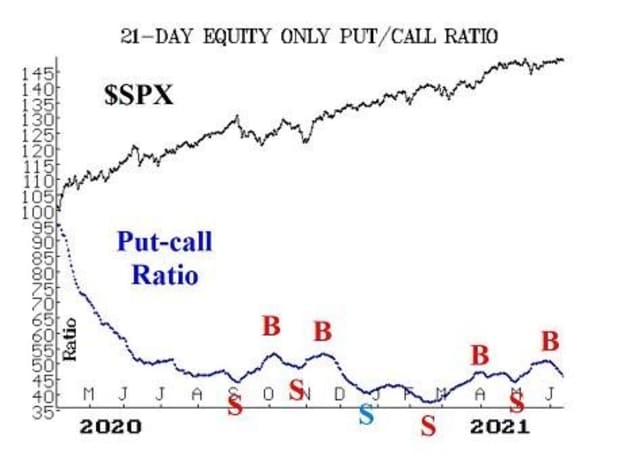
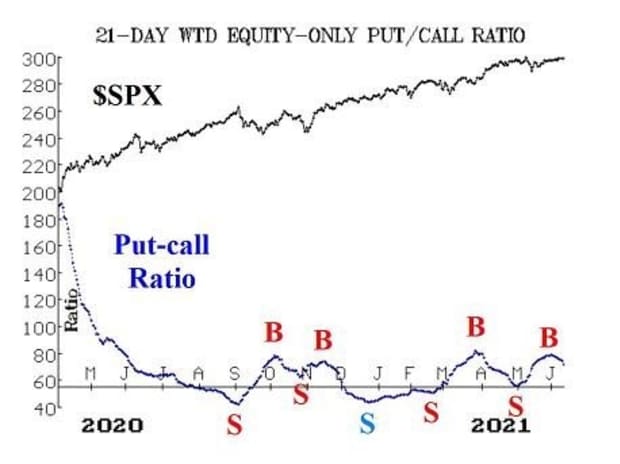
Equity-only put-call ratios have moved lower over the past week, and both indicators (the standard and weighted ratios) have issued buy signals as a result. There has been very heavy call buying, as the meme stocks — and others influenced by coordinated social media buying — have exploded in many cases once again. As long as these put-call ratios are declining, that is bullish for the stock market. Thus, these new buys signals are another improvement in the internal indicators.


Breadth has been strong and improving. Thus, both breadth oscillators remain on buy signals. They have moved into modestly overbought territory, which is a good thing when SPX is breaking out to new highs (well, almost breaking out). As such, the breadth oscillators can withstand a day or two of negative breadth without necessarily rolling over to sell signals. Moreover, the cumulative breadth indicators have made new all-time highs on eight of the last ten trading days.
New 52-week highs are completely dominant over new 52-week lows once again. In fact, on the New York Stock Exchange, new 52-week lows are back in the single digits. This indicator remains bullish for stocks.
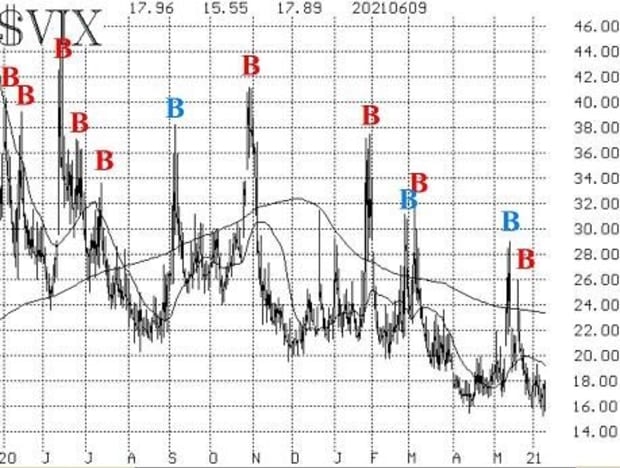
Volatility remains generally bullish in its outlook for the stock market, as well, although the CBOE Volatility Index VIX,

The construct of volatility derivatives is also a bullish factor for the stock market. The front-month VIX June futures expire next week. The July futures are trading with a very large premium to VIX (roughly 3.00 points), and the term structure of the VIX futures slopes upward through November. The CBOE Volatility Index term structure slopes upward too.
In summary, there are buy signals and improving indicators nearly everywhere. However, with confirmation from SPX, they don’t mean much. At this point, straddle buys are still a smart move, although a two-day close above 4238 by SPX will be an “all-clear” for a strong move to the upside.
New recommendation: Covanta Holding
Rumors circulated that Covanta Holding Corp. CVA,
Buy 6 CVA July (16th) 17.5 calls at a price of 1.00 or less.
CVA: 17.60 July (16th) 17.5 call: offered at 1.00
New recommendation: SmileDirectClub
The action around SmileDirectClub Inc. SDC,
Buy 4 SDC July (16th) 9 calls at a price of 1.50 or less.
SDC: 9.73 July (16th) 9 call: offered at 1.55
Follow-up action
All stops are mental closing stops unless otherwise noted.
Long 2 expiring SPY June (11th) 410 puts and short 2 SPY June (11th) 385 puts: this trade was originally taken because of the MVB sell signal that occurred on May 12th. It would be stopped out by SPX once again closing above the +4σ Band, which is at 4320 and moving sideways. The signal would reach its profit target if SPX trades at the -4σ Band. Right now, the lower Band is at about 4050 and rising slowly. We want to maintain a position here, because the sell signal is still in effect, so sell the current spread, and replace it by buying 2 SPY July (2nd) 410 puts. We are no longer using a spread here – just long puts.
Long 1 SPY June (18th) 420 put and Short 1 SPY Jun (18th) 400 put: this recommendation was based on the equity-only put-call ratio sell signal that was in place. Since that sell signal is no longer in place, exit this spread.
Long 3 DUK June (18th) 100 calls: hold without a stop while we wait for the activist investor to produce a positive result.
Long 2 SPY June (18th) 415 calls and Short 2 SPY June (18th) 428 calls: this spread was bought when the most recent VIX “spike peak” buy signal was confirmed on Friday, May 21st. It would be stopped out if VIX were to return to spiking mode – that is, if it rose at least 3.00 points over any 3-day or shorter period (using closing prices).
Long 1 KSU Jun (18th) 300 call: KSU has formally accepted the higher takeover bid from Canadian National (CNI). The deal is for $200 cash + 1.129 shares of CNI. So, with CNI at 110, the deal is worth $324.Of course, there will be regulatory delays. We are going to hold, so see if this spread can tighten somewhat. It is unclear whether or not Canadian Pacific – the other bidder – will come back with a superior offer or not. Finally, stop out the calls if CNI closes at 108 or lower.
Long 1 SPY July (16th) 420 call and Long 1 SPY July (16th) 420 put: this long straddle is in anticipation of SPX making a volatile move away from the 420 level. If SPX trades at 437, roll the calls up from the 420 strike to the 437 strike (or the closest strike to that). Conversely, if SPX trades at 403, roll the puts down to the 403 strike.
Long 4 CERN June (18th) 80 calls: hold without a stop while takeover rumors persist.
Long 4 CSOD July (16th) 47.5 calls: our recommendation was to buy these calls if CSOD closed above 47, which it did on June 4th. A 13-D filing was made by an activist investor, and the stock moved higher. Set a trailing, closing stop at 47.70.
Long 4 DBX July (16th) 28 calls: our recommendation was to buy these calls if DBX closed above 28.50, which it did on June 7th. This is also an “activist investor” situation. Set a trailing, closing stop at 27.
Send questions to: lmcmillan@optionstrategist.com.
Lawrence G. McMillan is president of McMillan Analysis, a registered investment and commodity trading advisor. McMillan may hold positions in securities recommended in this report, both personally and in client accounts. He is an experienced trader and money manager and is the author of the best-selling book, Options as a Strategic Investment. www.optionstrategist.com.


