As gold prices fall, there’s still not enough gloom to trigger a buy signal
CHAPEL HILL, N.C. — Notwithstanding gold’s $100 plunge over the last week, we still don’t have a contrarian buy signal.
That’s because the prevailing mood in the gold market GC00,
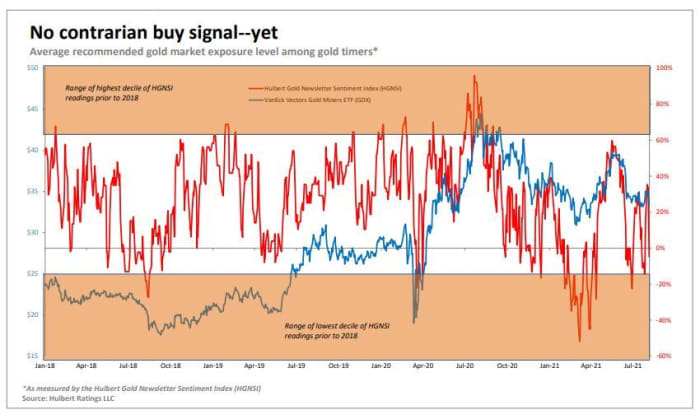
These are the conclusions I draw from an analysis of gold market timers’ average recommended gold exposure level (as measured by the Hulbert Gold Newsletter Sentiment Index, or HGNSI). This average currently stands at minus 4.8%, which means that the average timer is allocating a small portion of his gold trading portfolio to going short. Past contrarian gold signals have come when the HGNSI was even lower.
The HGNSI in late June did briefly dip down far enough to enter into the zone of extreme bearishness, which I define to be in the lowest 10% of all past readings. (This zone is beige-colored in the accompanying chart.) But the HGNSI dipped only barely into this zone and didn’t stay there for long; at the first sign of strength in the gold market, the average gold timer quickly turned more bullish. This is why, as I warned in an early-July column, gold’s subsequent rally would be quite modest and range bound.

The most sustainable rallies in the past have come when the average gold timer was not only extremely bearish, but stubbornly so. This is what happened in February and March of this year, as the chart illustrates: The HGNSI remained in the zone of extreme bearishness for over a month. Gold’s subsequent rally was impressive, with bullion rising over 13% and gold mining shares rising more than 22% (as measured by the VanEck Vectors Gold Miners ETF GDX,
In the rally that began in late June/early July, in contrast, neither bullion nor gold mining shares rose more than about 4%.
How long will it take until a strong contrarian buy signal? Contrarians typically don’t even attempt an answer, letting the markets tell their own story in real time. If the gold timers in coming days do finally throw in the towel, and then remain bearish in the wake of any initial show of gold strength, then a contrarian buy signal could come sooner rather than later.
If not, then we will have to wait.
S&P beats gold
This week is the 50th anniversary of the U.S. coming off the gold standard, as I discuss in The Wall Street Journal. It was on Aug. 15, 1971, when then President Nixon ended the convertibility of the U.S. dollar into gold bullion at the fixed price of $35 per ounce.
Since then, gold has produced an 8.1% annualized return over the last 50 years, including its recent weakness. That compares to 11.2% annualized over the same period for the S&P 500 SPX,
Mark Hulbert is a regular contributor to MarketWatch. His Hulbert Ratings tracks investment newsletters that pay a flat fee to be audited. He can be reached at mark@hulbertratings.com


