Santa Claus rally is off to best start in 20 years. Here’s what history says about the stock market’s performance when rally starts this well.
Santa Claus is handing out gifts on Wall Street.
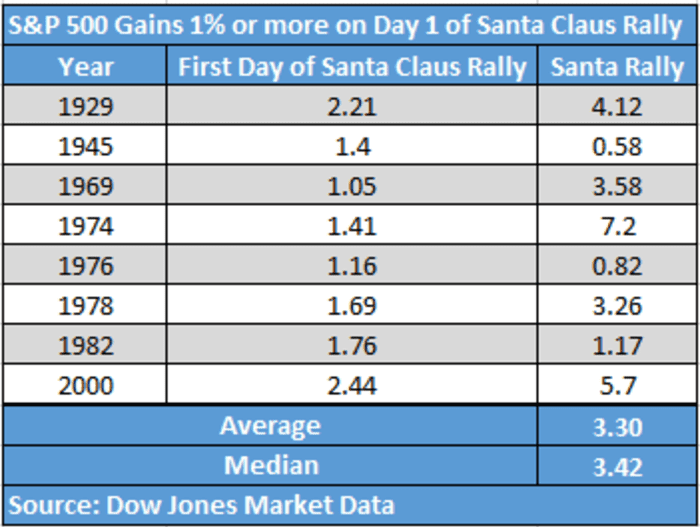
The so-called Santa Claus rally that tends to materialize in the U.S. stock market in the final week of December and the first two trading sessions of the new year, is off to its best start since 2000-01, when the market gained 5.7% over the period, according to Dow Jones Market Data.

In fact, in the eight occasions since 1929 when the index has gained at least 1% to start that seven-session trading period near the end of year, the Santa Claus rally has produced a gain 100% of the time, with an average gain of 3.3%.
At last check, the S&P 500 SPX,
The update mood on Monday to start the final week of trading in 2021 was helping to lift the Dow Jones Industrial Average DJIA,
Sign up for our Market Watch Newsletters here.
How does the market perform for the rest of January?
January on average tends to end higher, with a mean gain of 2.94% and median rise of 3.7%, when the S&P 500 has started the Santa Claus rally with an advance of at least 1%.
The Santa Claus rally trend was first identified by Yale Hirsch, the founder of the Stock Trader’s Almanac, which is now run by his son Jeff.
Hirsh was known for saying that “if Santa should fail to call, bears may come to Broad and Wall.”
Ryan Detrick, chief market strategist for LPL Financial, notes that losses during the Santa Claus rally period have tended to lead to negative results for January too. Those include losses during 1999, 2005, 2008, 2015 and 2016.
To be sure, past performance is no guarantee of future performance and the statistical trends for the market’s performance post-Santa Claus rally are fairly thin.
MarketWatch columnist Mark Hulbert writes that even with statistics and theory on its side, “the Santa Claus rally doesn’t amount to a guarantee.”
—Ken Jimenez contributed to this article.


