A bullish sign? Nasdaq investor sentiment is worse now than it was in March 2020
Bearishness has fallen to such an extreme that it supports a significant stock market rally.
Sentiment certainly has taken its time reaching this extreme. Just two weeks ago, when I last devoted a column to market sentiment, many short-term market timers were “stubbornly bullish,” treating every market dip as a buying opportunity.
That, in turn, suggested that even a short-term low was not yet at hand, according to contrarian analysis.
Most of those erstwhile bulls have now thrown in the towel. Indeed, some sentiment benchmarks are indicating that bearishness is more extreme today than it was at the March 2020 bottom, as the Covid-19 pandemic was sending the economy into a medically induced coma.
That doesn’t mean we should now expect a rally of the same magnitude as we saw from that March 2020 bottom. Contrarian analysis is a short-term market timing tool at best, providing insight into the market’s likely trend over only the subsequent month or two. Nevertheless, given today’s extreme bearish sentiment, contrarians are now expecting the stock market to be at or close to some sort of bottom.
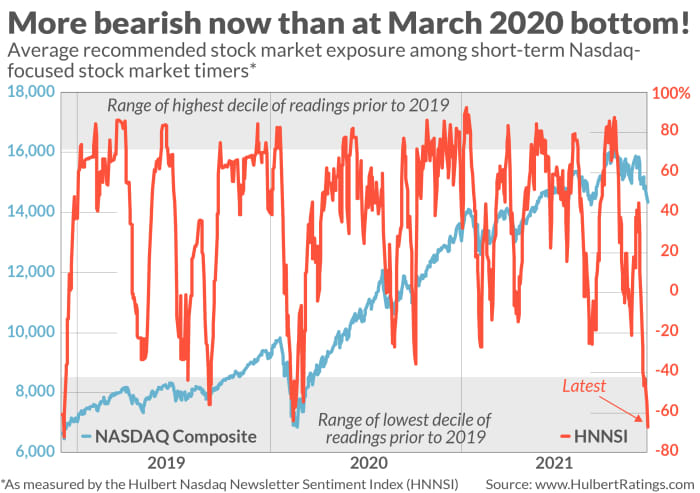
Consider, first, the bearish extreme to which Nasdaq-focused stock market timers have become. I measure their sentiment by calculating their average recommended equity exposure. (This average is what’s represented by the Hulbert Nasdaq Newsletter Sentiment Index, or HNNSI.)
This average currently stands at an incredible minus 67.2%, which means that the average Nasdaq-focused stock market timer is recommending that clients allocate two-thirds of their equity trading portfolios to going short. That’s an extremely aggressive bearish posture.

To put that level in context, consider that the lowest to which the HNNSI fell in March 2020 was “only” minus 64.0%. The current reading is lower than all but 1.8% of comparable readings since 2000. That’s well inside the bottom decile of the historical distribution, which some contrarians use to identify extreme bearishness. This bottom decile is shaded in the accompanying chart, above.
Also revealing is a comparison to the market timers’ behavior in March 2000. On the day that month when the Nasdaq Composite COMP,
This correction criterion was once again satisfied this week, but as you can see from the chart, this time the average timer’s recommended equity exposure was more than 100 percentage points lower than at the market’s top.
So, at least from a contrarian point of view, there is a big contrast between the market sentiment today and at the top of the internet bubble.
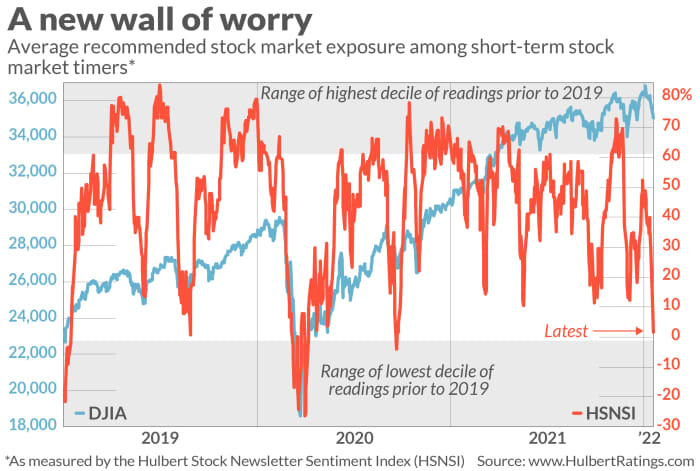
Stock market timers who focus on the broad stock market are not quite as bearish as their Nasdaq-focusing brethren, but they also are approaching a bearish extreme. The average recommended equity exposure among this group of broad-market focused timers (as represented by the Hulbert Stock Newsletter Sentiment Index, or HSNSI) stands at 1.6%, which is lower than 89% of all daily readings of the past two decades. That’s just on the edge of the bottom decile, as you can see in the second chart, below.

The rally that contrarians are now expecting may have already started. If so, how long and far may it go?
Contrarians typically avoid even guessing an answer to that question, instead letting the sentiment data unfold in real time. It would be an encouraging sign if the market timers respond to any market strength by stubbornly remaining bearish, and a bad sign if they quickly jump back on the bullish bandwagon.
We’ll know soon enough. In the meantime, look for market surprises to be on the upside.
Mark Hulbert is a regular contributor to MarketWatch. His Hulbert Ratings tracks investment newsletters that pay a flat fee to be audited. He can be reached at [email protected].


