Bitcoin Dips Below $40K as ‘Death Cross’ Looms in Price Charts

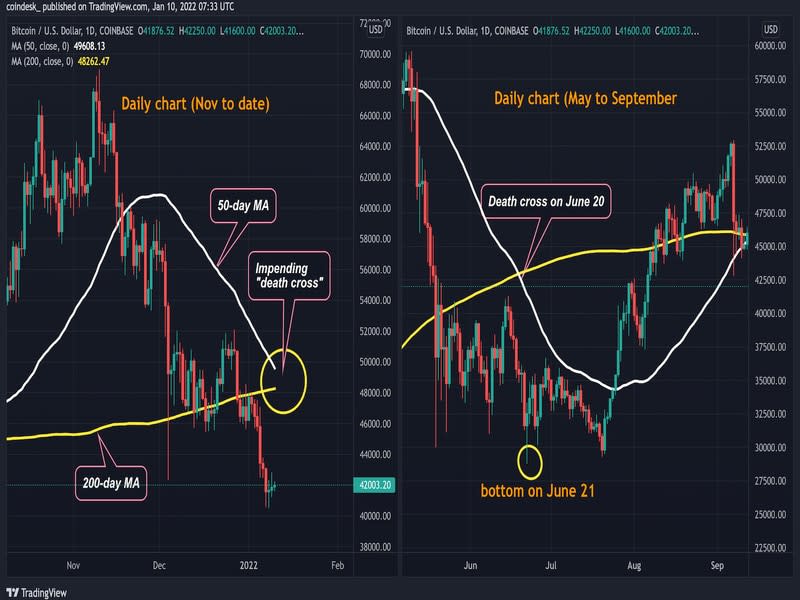
They call it bitcoin’s “death cross” – a bearish indicator which appears when the 50-day moving average (MA) dips below the 200-day MA.
The ominously-named chart pattern looks set to be confirmed this week amid mounting concerns of faster liquidity withdrawal by the U.S. Federal Reserve (Fed), a bearish development for bitcoin and asset prices, in general.
On Monday, the bitcoin (BTC) price dipped briefly below $40,000 for the first time since September 2021. As of press time the largest cryptocurrency was changing hands at $40,834, based on CoinDesk pricing, down 12% so far in 2022, one of bitcoin’s worst-ever starts to a year.
The Wall Street firm Goldman Sachs foresees the Fed raising borrowing costs at least four times by the end of 2022 versus the previous prediction of three rate hikes, according to Bloomberg. The investment banking giant also expects the central bank to downsize its balance sheet from July.
Friday’s U.S. labor market report, which showed that unemployment rate dipped to 3.9%, has strengthened the case for the Fed to hike rates concurrently with the end of asset purchases in March. According to the CME Group’s FedWatch Tool, investors were pricing a 73% probability of a 25 basis point rate hike in March, up from 61% last week.
Fears of a hawkish Fed gripped the bitcoin market towards the end of last quarter after the central bank shifted its focus to inflation control from maximum employment. In December, the Fed announced at least three rate hikes by the end of 2022 and an end of the asset purchase program by March.
Bitcoin peaked near $69,000 on Nov. 10 and has declined nearly 40% since. The cryptocurrency slipped over 12% in the last seven days to Jan. 9, registering its biggest weekly drop since early December. The impending death cross, coupled with the souring macro outlook, may bolster overall bearish sentiment.
That said, the technical indicator’s past record as a predictor of bear markets is mixed. According to research by Kraken, many of bitcoin’s previous death crosses, including those seen in 2014 and 2018, coincided with “either a sell-off in the days that followed or a continued macro downtrend that confirmed a bear market.”
However, death crosses witnessed in June 2021, late March 2020, and October 2019 were bear traps or false signals that marked major price bottoms. The consolidation seen after the mid-June 2021 death cross resolved in a fresh bull run, as seen in the featured image.
Moving average crossovers are unreliable as standalone indicators, given they are based on backward-looking data and tend to lag prices. The market is often oversold and due for a bounce by the time the crossover is confirmed, as was the case in June last year and late March 2020.


