Pass on Alphabet Stock Trades for Now
It’s been over a month since Alphabet (NASDAQ:GOOGL, GOOG) first announced a 20-for-1 stock split. And that gives us enough price data to parse to determine how the market has responded. It’s a job made more difficult by Russia’s invasion of Ukraine, not to mention the accompanying commodity boom and inflationary pressures that come with it. But try we must. So far, GOOG stock has fared better than most tech stocks, but it’s still in an out of favor sector.

Source: IgorGolovniov / Shutterstock.com
Indeed, all companies falling under the growth banner have seen souring sentiment and deteriorating price charts. Sure, Alphabet is mega-profitable and has a fortress of a balance sheet. But it’s a boat swimming upstream. And the current is strong.
The Technology Sector ETF (NYSEARCA:XLK) is down 17.9% from its peak and mired in a downtrend. With that backdrop, it’s difficult for any tech heavyweight to post positive numbers.
InvestorPlace – Stock Market News, Stock Advice & Trading Tips
But Alphabet doesn’t have to have risen to show strength. Simply falling less still qualifies as outperformance. From peak to trough, GOOG stock is down 13.1%.
Outperformance achieved!
GOOG Stock: Alphabet Spells Relative Strength
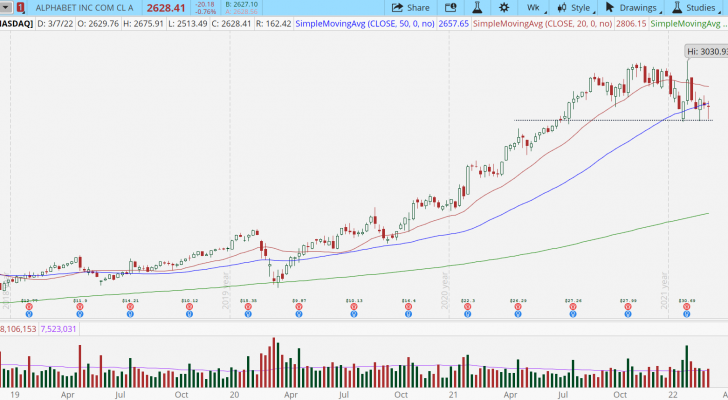
This year’s decline pushed prices below the 20-week and 50-week moving averages. But sellers are finding it challenging to keep prices below the 50-week.
Support has formed at the psychologically significant round number of $2,500, and three bullish reversal bars have started there in recent weeks. While the damage has been ugly enough to pull the 20-week lower, the 50-week is still rising.

Source: The thinkorswim® platform from TD Ameritrade
At -13.1%, the decline is more than a pullback but less than a full-fledged bear market. For now, we’re in correction territory. There are two reasons behind the relative strength.
First, Alphabet is flush with profits. It’s unprofitable growth stocks that are bearing the brunt of the damage. One of the reasons for its explosive move higher during February’s earnings announcement was the stock split, but the other was the record $75.33 billion the company raked in. It represented 32% in revenue growth and translated into earnings per share of $30.69, which smashed expectations for $27.34.
Second, excitement over the upcoming stock split is helping to keep sellers at bay. Some shareholders rightly view the event as a positive catalyst that could speed up the next recovery. And while they could sell now and get back in later, either before or after the split, they don’t want to run the risk they have to buy back in at higher prices. Thus, they’re staying put.
A Look at the Daily Chart

Source: The thinkorswim® platform from TD Ameritrade
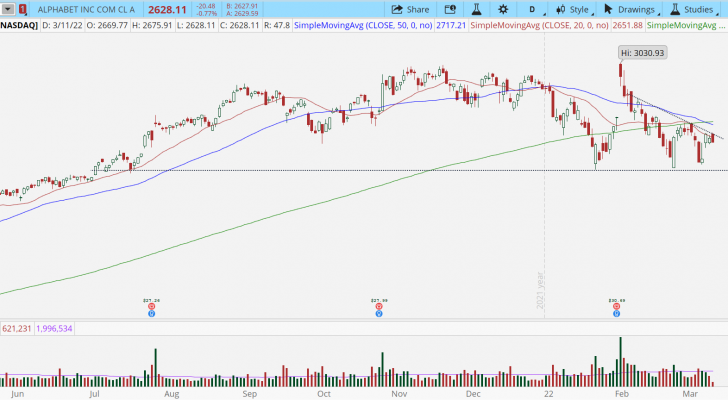
The daily chart chronicles the rollover since the failed earnings gap. A series of lower highs have formed, revealing increased seller aggression on each rally. Simultaneously, support has returned at $2,500 to stave off a deeper decline. This creates a descending triangle making it easy to spot the levels that need to be breached to change the status quo.
With falling 200-day, 50-day, and 20-day moving averages, you have to give sellers the benefit of the doubt here. Even if you want to buy, doing so now is a bad idea. We just completed a three-day run into the declining trendline and the 20-day. This is as logical a level as any for bears to step up. If you want to buy, wait for a return to $2,500 or a breakout over $2750 to clear overhead resistance. Until then, this is a stay away for buyers.
As for bears, I suggest you hunt elsewhere. Sure, you can short GOOG stock, but why? It’s exhibiting relative strength and is one of the better-looking tech stocks. You’ll find far easier prey elsewhere in the tech sector.
On the date of publication, Tyler Craig did not have (either directly or indirectly) any positions in the securities mentioned in this article.
More From InvestorPlace
The post Pass on Alphabet Stock Trades for Now appeared first on InvestorPlace.


