Stock-market investors should watch this part of the yield curve for the ‘best leading indicator of trouble ahead’
Investors have been watching the U.S. Treasury yield curve for inversions, a reliable predictor of past economic downturns.
They don’t always agree on which part of the curve is best to watch though.
“Yield curve inversion, and flatting, has been at the forefront for everyone,” said Pete Duffy, chief investment officer at Penn Capital Management Company, in Philadelphia, by phone.
“That’s because the Fed is so active and rates suddenly have gone up so quickly.”
An inversion of the yield curve happens when rates on longer bonds fall below those of shorter-term debt, a sign that investors think economic woes could lie ahead. Fears of an economic slowdown have been mounting as the Federal Reserve starts to tighten financial conditions while Russia’s Ukraine invasion threatens to keep key drivers of U.S. inflation high.
Lately, the attention has been on the 10-year Treasury yield TMUBMUSD10Y,
Read: The yield curve is speeding toward inversion — here’s what investors need to know
But that’s not the only plot on the Treasury yield curve investors closely watch. The Treasury Department sells securities that mature in a range from a few days to 30 years, providing a lot of plots on the curve to follow.
“The focus has been on the 10s and 2s,” said Mark Heppenstall, chief investment officer at Penn Mutual Asset Management, in Horsham, Penn, a northern suburb of Philadelphia.
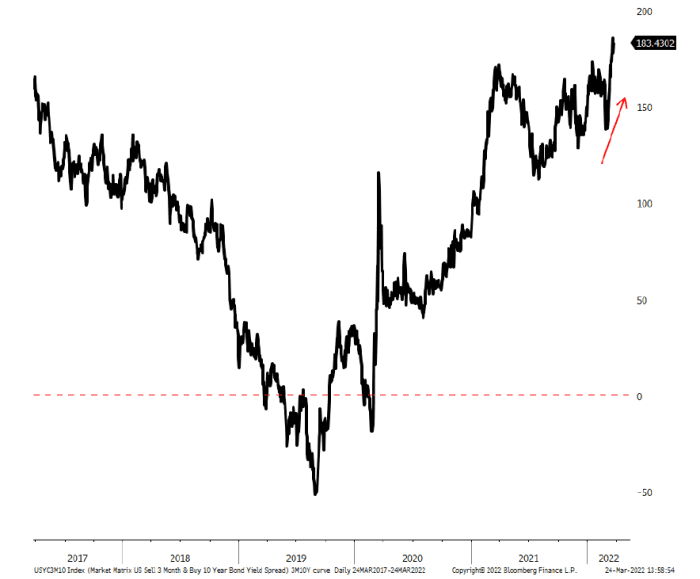
“I will hold out until the 10s to 3-month bills inverts before I turn too negative on the economic outlook,” he said, calling it “the best leading indicator of trouble ahead.”
Watch 10-year, 3-month
Instead of falling, that spread climbed in March, continuing its path higher since turning negative two years ago at the onset of the pandemic (see chart).

The 3-month to 10-year yield spread is climbing
Bloomberg data, Goelzer Investment Management
“The 3-month Treasury bill really tracks the Federal Reserve’s target rate,” said Gavin Stephens, director of portfolio management at Goelzer Investment Management in Indiana, by phone.
“So it gives you a more immediate picture of if the Federal Reserve has entered a restrictive state in terms of monetary policy and, thus, giving the possibility that economic growth is going to contract, which would be bad for stocks.”
Stocks were lower Friday, but with the S&P 500 index SPX,
By watching the 10s and 2s TMUBMUSD02Y,
On average, from the time the 10s and 2s curve inverts, until “there’s a recession, it’s almost two years,” he said, predicting that with unemployment recently pegged around 3.8% that, “this curve is going to invert when the economy is really strong.”
The Federal Reserve Bank of San Francisco also called the 3-month TMUBMUSD03M,
“Did it see COVID coming?” Duffy said, of earlier yield curve inversions.
A more likely catalyst was that investors already were on a recession watch, with the American economy in its longest expansion period on record.
“There are a number of these curves that you need to look at in totality,” Duffy said. “We’ve always said look at many signals.”


