Bear markets and a truth about investing
The stock market continues to trend lower.
Before rallying on Friday, the S&P 500 had a closing low of 3,930.08 on Thursday, down 18.1% from its all-time closing high of 4,796.56 on January 3.
If you consider the intraday market action, the S&P traded as low as 3,858.87 on Thursday, down 19.9% from its intraday high of 4,818.62 on January 4.
Technically speaking, stocks don’t enter a “bear market” until prices are down at least 20% from their highs. And for most market watchers, this calculation is based on closing prices. Frankly, this is all silly semantics about round numbers and rounding errors.
Any way you look at it, the stock market is down a lot.

Learning from history
We could debate all of the ways that the present day is and isn’t like history’s bull and bear markets, but that’s unlikely to end with a definitive conclusion.1 Nevertheless, let’s do a quick review of historical market performance.
Technically, we’re in year three of a bull market that began on March 23, 2020.
Ryan Detrick, chief market strategist at LPL Financial, reviewed the history and found that three of the 11 bull markets since World War II ended in year three. So from the perspective of duration, it wouldn’t be too unusual for stocks to be in a full-blown bear market some time before March 2023.

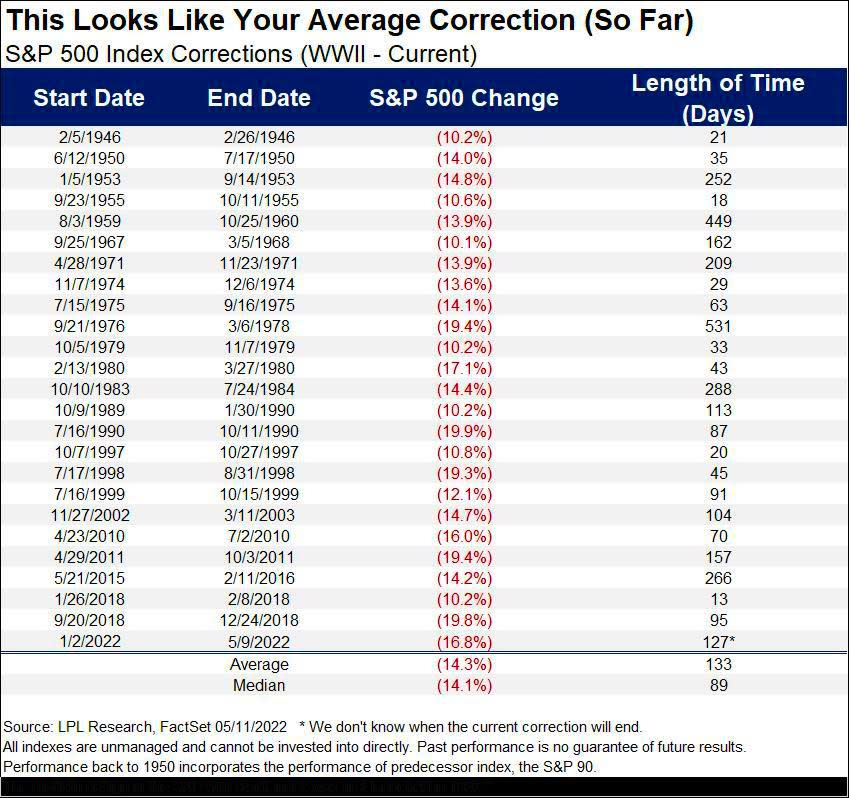
On the matter of duration, history’s stock market corrections (i.e., when the stock market falls by more than 10% but less than 20%) have had an average length of 133 days from market top to market bottom, according to data compiled by Detrick.
The current correction has run for 131 days as of Friday, which makes it pretty close to average assuming the market inflects upward soon.

And since we’re very close to being in a technical bear market, now is a good time to talk about history’s bear markets. Ben Carlson, director of institutional asset management at Ritholtz Wealth Management, reviewed the historical data.
Since 1950, the average bear market lasted 338 days (with a range of 33 to 929 days) and saw the S&P 500 fall an average 30.2% (with a maximum decline of 56.8%).
It’s worth noting that many — but not all — bear markets came with economic recessions. And as you might expect, the bear markets amid recessions tended to be worse.
Carlson observed that since 1929, recessionary bear markets lasted an average 390 days peak to trough, with stocks falling an average 39.4% during that period. Meanwhile, non-recessionary bear markets lasted an average 202 days with stocks falling an average 26.1%.
This is what investors signed up for
When talking to novices about investing in the stock market, I try to make it a point to say that you can get smoked in the short-term. In fact, TKer Stock Market Truth No. 2 is literally: “You can get smoked in the short-term.”2
Huge stock market sell-offs are normal. The S&P has historically seen an average annual max drawdown (i.e. the biggest intra-year sell-off) of 14%. Some years see milder sell-offs. Other years see worse ones.
This all speaks to two conflicting realities investors must cope with: In the long run, things almost always work out for the better, but in the short run, anything and everything can go wrong. This is what investing in the stock market is all about.
A note about the current moment…
The economic data continues to be very strong, and there continue to be massive tailwinds that suggest growth will persist.
Similarly, expectations for earnings growth have been improving. Taken with falling prices, valuations are increasingly attractive.
As of Friday, the forward P/E ratio on the S&P 500 was 16.6, according to FactSet. This is below its 10-year average of 16.9.
This combination of resilient economic growth, improving earnings expectations, and attractive valuations has at least some Wall Street pros advising clients to take on risk.
And history says that sell-offs like the one we’re experiencing now, are often followed by sharp recoveries.
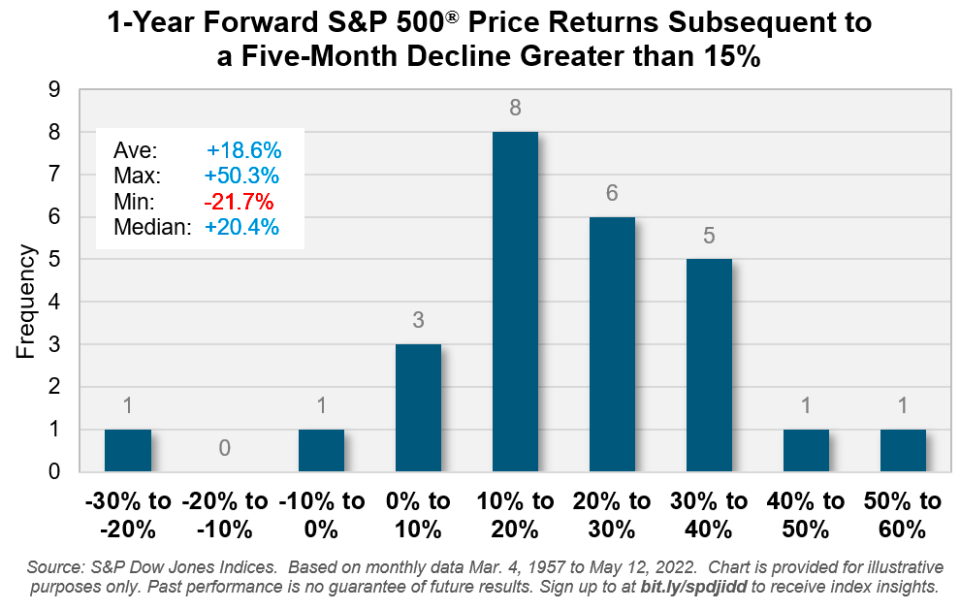
According data from Benedek Vörös, director of index investment strategy at S&P Dow Jones Indices, “a decline of 15% or more [over a five-month period] for the S&P 500 has been followed by positive returns in the ensuing 12 months in all but two occasions over the past 65 years, with an average gain just shy of 20%.“

Of course, there’s no guarantee that metrics continue to move favorably, especially as the Federal Reserve actively moves to cool demand in the economy. And it’s certainly possible that stocks continue to fall, regardless of what the data justifies.
But on balance, overall conditions continue to appear favorable for investors who are able to put in the time.
—
Related reading from TKer:
Rearview ?
? Stocks keep falling: The S&P 500 declined 2.4% last week. The index is now down 16.1% from its January 3 closing high of 4796.56. For more on market volatility, read this and this.
Earnings growth, however, remains firm, which has caused valuations to become much more attractive. For more on valuations, read this and this.
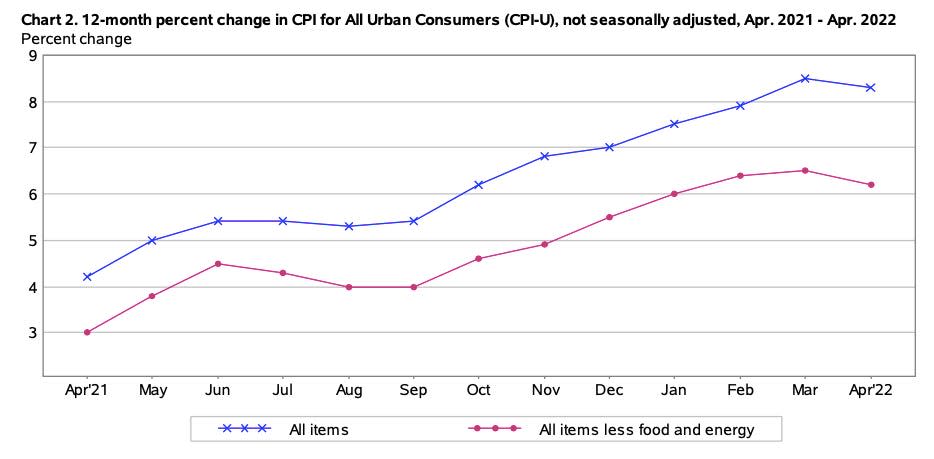
? Inflation is high, but off its high: The consumer price index (CPI) climbed 0.3% in April from March. CPI is 8.3% above year ago levels. Core CPI, which excludes food and energy, rose 0.6% month-over month, reflecting a 6.2% year-over-year gain.

The decline in the annual figures supports the idea that inflation may have peaked in March. Though, nobody is ready to celebrate yet. “Despite the April data suggesting a peak might have been reached for y/y CPI, the renewed rise in gasoline prices towards a record $4.50 nationally and increase in diesel prices signals that there is still upward risk to the inflation outlook,” Kathy Bostjancic, chief U.S. financial economist at Oxford Economics, wrote on Tuesday. “Further, the Covid-related China lockdowns and the continued Russia-Ukraine war places further stress on already strained supply chains.“
? Some thoughts on the CPI details: One of the categories that jumped out of the CPI report was airline fares, which spiked 18.6% month-over-month in April. This is no surprise for anyone who’s traveled recently. There are a lot of people going out and doing stuff. It’s a reflection of a booming economy, not a stagnating one.
“Details confirmed stagflation is unlikely,” Paul Donovan, chief economist of UBS Global Wealth Management, said on Wednesday. “Stagflation occurs when an item’s inflation increases at the same time as demand falls… [The CPI] data showed that where demand fell, inflation slowed or turned to deflation. If demand is rising, prices are rising. US airfares roared ahead, reflecting an ongoing desire to travel.”
“The U.S. economy remains in an inflationary boom,” Neil Dutta, head of U.S. economics at Renaissance Macro, said in an email on Tuesday. “That’s the only way to describe above consensus employment growth and inflation over the month of April.”
If you want a high-level look at how prices moved for some categories, check out the table in my tweet. If you want a detailed look at all of the categories, you can download the full BLS reporter.
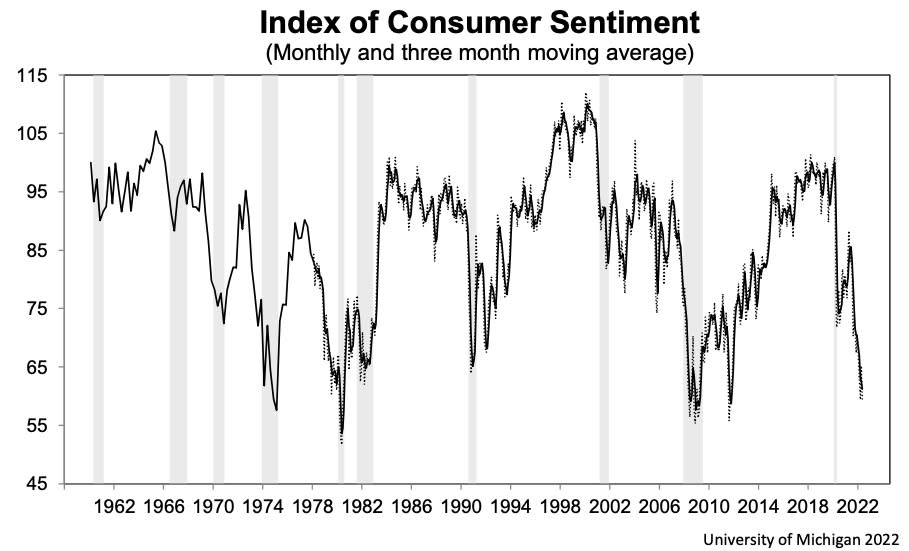
? Consumer sentiment tumbles: The University of Michigan’s index of consumer sentiment fell 9.4% to 59.1 in May, its lowest level since August 2011. From the survey: “Consumers’ assessment of their current financial situation relative to a year ago is at its lowest reading since 2013, with 36% of consumers attributing their negative assessment to inflation. Buying conditions for durables reached its lowest reading since the question began appearing on the monthly surveys in 1978, again primarily due to high prices. The median expected year-ahead inflation rate was 5.4%, little changed over the last three months, and up from 4.6% in May 2021.“

Keep in mind that deteriorating sentiment hasn’t come with a decline in spending in recent months. For more on sentiment, read this.
Up the road ?
It’s a big week for consumer spending data, especially following that gloomy consumer sentiment report.
On Tuesday, we’ll get the April retail sales report. Economists estimate sales climbed by 0.9% during the month. Excluding autos and gas, sales are estimated to have increased by 0.7%.
The week also comes with earnings announcements from Walmart, Home Depot, Target, Lowe’s, TJX Companies, Colgate-Palmolive, and Kohl’s.
Read the latest financial and business news from Yahoo Finance
Follow Yahoo Finance on Twitter, Facebook, Instagram, Flipboard, LinkedIn, and YouTube


