Small-cap growth stocks are the cheapest they’ve been in at least 24 years. Here’s how one manager is playing it.
Growth stocks typically trade at premium prices. But in this market, rising interest rates have turned small-cap growth stocks into a bargain group. This may be a beautiful setup for long-term investors.
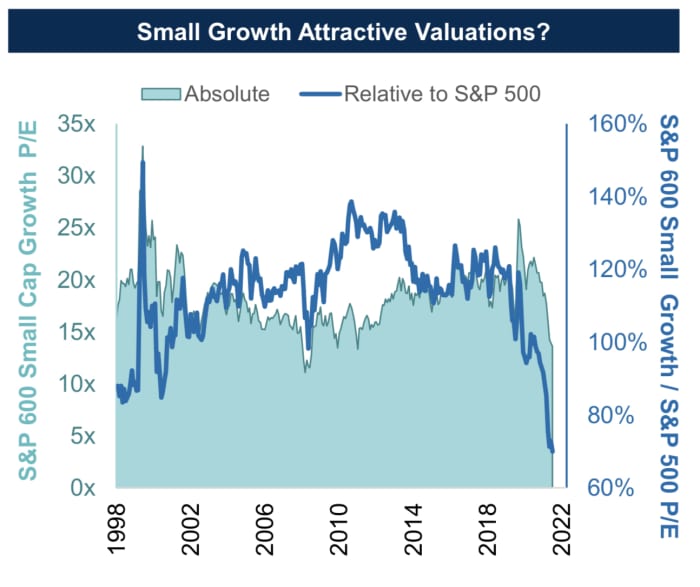
The following chart, provided by Alger Director of Market Strategy Bradford Neuman, underscores the opportunity:

The chart shows the weighted forward price-to-earnings ratio for the S&P Small Cap 600 Growth Index SP600G,
Alger is based in New York and manages about $35.5 billion through funds and private accounts.
In a note to clients, Neuman wrote that the current market environment “may be the best of both worlds for small-cap growth investors, given that these stocks are less expensive than small-value equities, and they generally also have higher operating margins, return on capital and stronger balance sheets.”
This is the cheapest that the S&P Small Cap 600 Growth Index has been, relative to the S&P 500, since FactSet started tracking the data in 1998. This is a subset of the S&P 600 Small Cap Growth Index SML,
The index is tracked by the iShares S&P Small-Cap 600 Growth ETF IJT,
Here’s a look at small-cap index ETF valuations relative to the SPDR S&P 500 ETF SPY,
| Index | Ticker | Current forward P/E | 10-year average forward P/E | Current valuation to 10-year average | Current valuation to S&P 500 | 10-year average valuation to S&P 500 |
| iShares Core S&P Small Cap ETF | IJR | 11.88 | 17.66 | 67% | 68% | 103% |
| iShares S&P Small-Cap 600 Growth ETF | IJT, |
12.16 | 19.15 | 63% | 69% | 112% |
| iShares S&P Small-Cap 600 Value ETF | IJS, |
11.70 | 16.58 | 71% | 67% | 97% |
| SPDR S&P 500 ETF Trust | SPY, |
17.50 | 17.13 | 102% | 100% | |
| Source: FactSet | ||||||
Over the past 10 years, the iShares S&P Small-Cap 600 Growth ETF has traded well above the forward P/E valuation of SPY on average. But now it is the cheapest of the listed ETFs relative to the large-cap benchmark, at 63%.
During an interview, Neuman said that the movement of rolling forward consensus estimates among analysts polled by FactSet further underscored the inexpensiveness of small-cap growth stocks:
| ETF | Estimated sales per share – NTM – May 31, 2022 | Estimated sales per share – May 31, 2021 | Sales estimate Increase | Estimated EPS – May 31, 2022 | Estimated EPS – May 31, 2021 | EPS estimate increase |
| iShares Core S&P Small Cap ETF | $113.87 | $94.37 | 21% | $8.45 | $6.31 | 34% |
| iShares S&P Small-Cap 600 Growth ETF | $88.65 | $73.35 | 21% | $9.30 | $6.33 | 47% |
| iShares S&P Small-Cap 600 Value ETF | $141.71 | $114.24 | 24% | $8.36 | $6.64 | 26% |
| SPDR S&P 500 ETF Trust | $175.15 | $152.60 | 15% | $23.79 | $19.82 | 20% |
| Source: FactSet | ||||||
Over the past year, as the consensus forward 12-month EPS estimate for the small-cap growth group increased by 47%, the ETF was down 11%. Meanwhile, SPY’s EPS estimate increased 20% while its shares were flat. (Both with dividends reinvested.)
Neuman called this a “divergence between the market and fundamentals.” He further explained that since investors in small-cap growth companies are paying, in part, for cash flows that are several years away, they are especially sensitive to rising interest rates.
“Small-cap companies have grown their earnings much more quickly, and their price has gone down also much more quickly,” he said.
An attractive small-cap growth stock
Neuman named FirstService Corp. FSV,
FirstService’s customers are mainly homeowners’ associations and communities of high-rise properties.
“They have gained a tremendous amount of market share over time, and grown their business by double digits by making acquisitions to roll up the property management industry,” Neuman said.
He said the acquisitions have added to the breadth of the company’s services, making it more efficient to enable even more expansion.
Over the past five years through 2021, the company has increased its sales per share at a compound annual growth rate of 34% and its earnings per share at a CAGR of 82% (based on FactSet’s data, reported in Canadian dollars for its shares listed on the Toronto Stock Exchange).
Over the 12 months through May 31, FirstService’s rolling forward EPS estimate has increased 23%, while its share price has declined 17%.
Top holdings of the Alger Weatherbie Specialized Growth Fund
Here are the fund’s top 10 holdings (out of 49) as of April 30:
| Company | Ticker | Industry | % of portfolio |
| Casella Waste Systems Inc. Class A | CWST | Environmental Services | 6.0% |
| FirstService Corp | FSV, |
Real Estate Development | 5.8% |
| Montrose Environmental Group Inc. | MEG, |
Misc. Commercial Services | 5.5% |
| SPS Commerce Inc. | SPSC, |
Software | 5.4% |
| SiteOne Landscape Supply Inc. | SITE, |
Wholesale Distributors | 5.1% |
| Progyny Inc. | PGNY, |
Misc. Commercial Services | 4.8% |
| Globant S.A. | GLOB, |
Information Technology Services | 4.5% |
| Hamilton Lane Inc. Class A | HLNE, |
Investment Managers | 4.4% |
| Chegg Inc. | CHGG, |
Misc. Commercial Services | 4.3% |
| Core Laboratories NV | CLB, |
Oilfield Services/ Equipment | 4.0% |
| Source: FactSet | |||
Click on the tickers for more about each company.
Read Tomi Kilgore’s detailed guide to the wealth of information for free on the MarketWatch quote page.


