Bitcoin (BTC) Fear & Greed Index on the Border of the “Fear” Zone
Key Insights:
-
Bitcoin (BTC) rose by 1.79% on Saturday to extend its winning streak to four sessions.
-
Market sentiment towards US retail sales figures and further reaction to FOMC member chatter delivered support.
-
The Bitcoin Fear & Greed Index increased from 21/100 to 24/100, reflecting improving investor sentiment.
On Saturday, bitcoin (BTC) rose by 1.79%. Following a 1.21% gain on Friday, BTC ended the day at $21,199. It was a fourth consecutive day in the green, with market sentiment towards Fed monetary policy delivering support.
A bearish start to the day saw BTC fall to a low of $20,481 before making a move.
Coming within range of the First Major Support Level at $20,405, BTC rallied to a high of $21,575.
BTC broke through the First Major Resistance Level at $21,215 before falling back to sub-$21,200. Despite the late pullback, BTC held onto the $21,000 handle for the first time since July 9.
With the US markets closed, FOMC member chatter from Friday and the upbeat US retail sales figures continued to deliver support.
Bitcoin Fear & Greed Index Inches toward the “Fear” Zone
Today, the Fear & Greed Index increased from 21/100 to 24/100. Matching the Index level from July 9 and 10, the Index stood at the highest level since May 5 (27/100).
The latest move back towards the “Fear” zone, which begins at 25/100, came off the back of a BTC return to $21,000.
The bulls will now look for a return to the “Fear” zone to support a BTC run at $25,000.

Bitcoin (BTC) Price Action
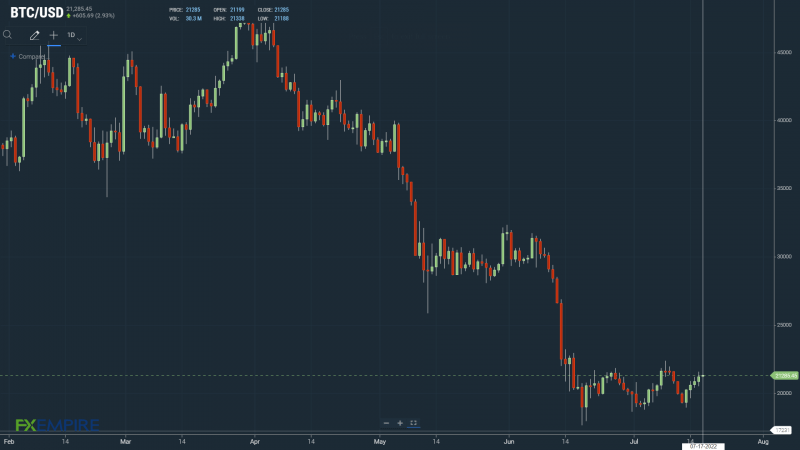
At the time of writing, BTC was up 0.41% to $21,285.
A choppy start to the day saw BTC fall to an early low of $21,188 before rising to a high of $21,338.

Technical Indicators
BTC needs to avoid the $21,086 pivot to target the First Major Resistance Level (R1) at $21,689.
BTC would need a bullish session to support a breakout from the Saturday high of $21,575.
An extended rally would test the Second Major Resistance Level (R2) at $22,180 and resistance at $25,000. The Third Major Resistance Level (R3) sits at $23,273.
A fall through the pivot would bring the First Major Support Level (S1) at $20,595 into play.
Barring an extended sell-off, the Second Major Support Level (S2) at $19,992 should keep BTC from a fall to sub-$19,500.
The Third Major Support Level (S3) sits at $18,897.

Looking at the EMAs and the 4-hourly candlestick chart (below), it was a bullish signal. This morning, bitcoin sat above the 100-day EMA, currently at $20,644.
The 50-day EMA closed in on the 100-day EMA, with the 100-day EMA narrowed to the 200-day EMA; positive BTC indicators.
A bullish cross of the 50-day EMA through the 100-day EMA would bring $22,000 into play.
A hold above the 100-day EMA and a breakout from R1 and the 200-day EMA, currently at $21,875, would target R2.

On a trend analysis basis, bitcoin would need a move through a May 30 high of $32,503 to target the March 28 high of $48,192. Near-term, resistance at $25,000 will likely be the first test should the upward trend resume.
For the bears, the June 18 low of $17,601 would be the next target, with a fall through the current week low of $18,919 likely to test investor resilience.
This article was originally posted on FX Empire


