Bitcoin (BTC) Price Prediction 2030: Is $1,000,000 Too Conservative?
Key Insights:
-
On November 10, bitcoin (BTC) struck an all-time high of $68,979 before sliding to a June 18 current year low of $17,601.
-
However, an extended crypto winter has not materially impacted BTC price projections, despite crypto market defaults and bankruptcies.
-
More hawkish projections have bitcoin at just shy of $1 million by 2030.
Since the early days, the bitcoin (BTC) story has been one of highs and lows. However, not too dissimilar to other riskier assets, the general trend has been upwards, with bitcoin printing new highs while avoiding new lows.
In December 2017, BTC struck a high of $19,871. A year-long bull run, driven by a hot ICO market, saw BTC surge from a January low of $740. BTC ended the year up by 1,338% to $13,850.
A late December pullback marked the beginning of the first real crypto winter, with BTC tumbling to a December 2018 low of $3,170.
However, the great bull run of 2020 that culminated in the November 2021 ATH followed an uneventful 2019.
From a March 2020 low of $3,949, BTC surged by an impressive 1,648% to the ATH $68,979 before the latest sell-off.
The great bull run was pivotal for bitcoin and the crypto market. Bitcoin etched its name into the list of great investment stories alongside names such as Intel (INTC) and Microsoft (MSFT). Significantly, the bull run also led to a material shift in sentiment towards bitcoin and the broader market.
Stickier institutional money entered the space, delivering a downside cushion once missing. This cushion supported a jump in interest from the retail side, comforted with the knowledge that even institutional investment strategies have embraced the digital asset space.
While bitcoin price projections over shorter time horizons are abundant, there are fewer projections looking further out.
Bitcoin (BTC) Price Action
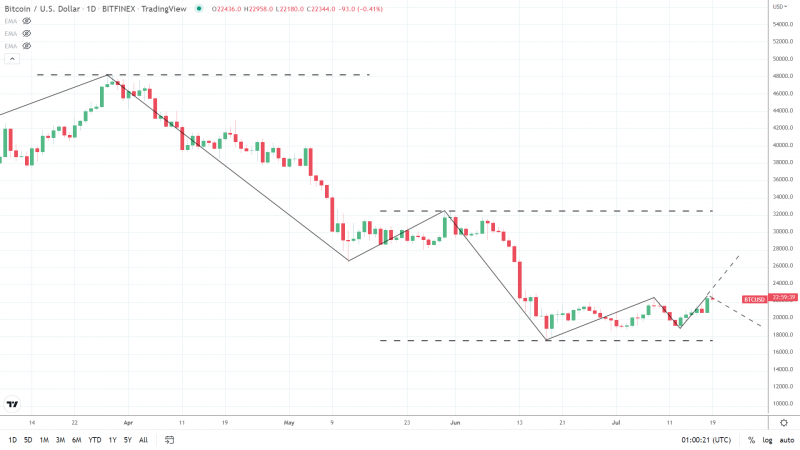
For the current year, BTC is down 53% to $21,909. Four months in the red from six that included a 37.4% slump in June delivered the downside, with BTC falling to a low of $17,601 before finding support.
Technical Indicators for 2022
Looking at the Major Support and Resistance Levels calculated based on calendar year movements, BTC needs to move through the First Major Support Level (S1) at $26,800 and the $47,900 pivot to target the First Major Resistance Level (R1) at $67,280 and the ATH $68,979.
A sustained market rebound is needed to support a return to $50,000.
In the event of a momentum-driven rebound and extended rally beyond R1, the bulls will target the Second Major Resistance Level (R2) at $88,374.
A run at R2 aligns with the FX Empire price prediction for 2022, which pointed to a move beyond $80,000 by year-end.
Failure to move through S1 and the pivot would bring the sub-$10,000 and the Second Major Support Level (S2) at $7,420 into play.
However, a drop below $10,000 would unlikely have a material impact on 2030 price projections.

Looking at the EMAs and the daily candlestick chart (below), it is a bearish signal. This month, bitcoin sits below the 50-day EMA, currently at $23,366.
The 50-day EMA pulled back from the 100-day EMA, with the 100-day EMA falling back from the 200-day EMA, both negative BTC indicators.
A BTC move through the 50-day EMA and S1 would bring the 100-day EMA, currently at $27,800, into play. From $27,800, BTC will need to break out from the 200-day EMA, currently at $33,600, to target the pivot and bring about a bearish trend reversal.
Key resistance levels, therefore, include $23,366, $26,800, $27,800, and $33,600.

On a trend analysis basis, bitcoin would need a move through S1 to target the June high of $31,956. From $32,000, BTC should have a clear run at the May high of $40,004 to target the start of the year open of $46,197.
However, breaking resistance down at the above levels would be the key to supporting a sustained BTC uptrend.
For the bears, the June 18 low of $17,601 would be the next target, with a fall through the July low of $18,919 likely to test investor resilience.

Bitcoin 2030 Price Prediction Bullish with $1,000,000 the Target Price
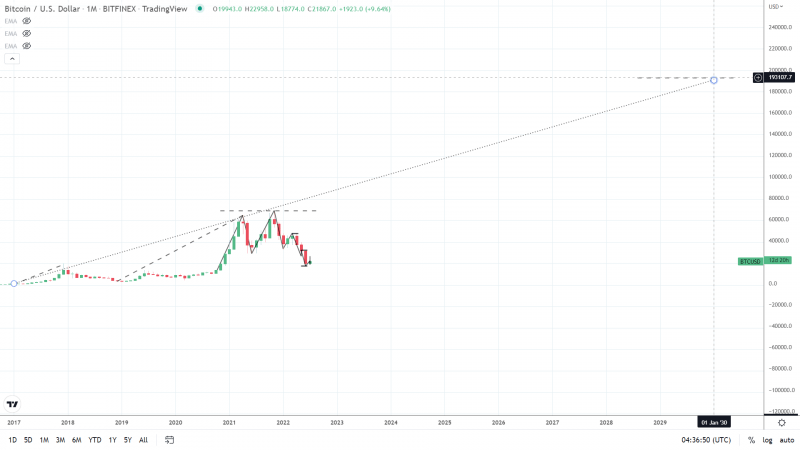
By carrying out a rudimentary extrapolation of BTC price movements since 2017, BTC is on a run rate to hit $191,000 by January 2030.

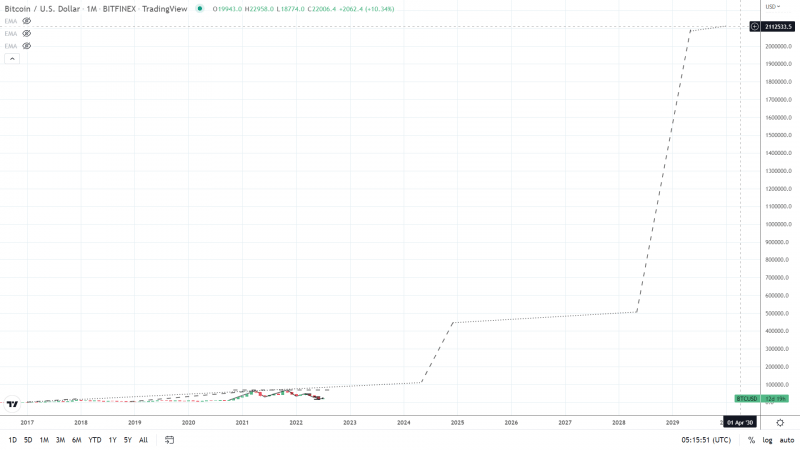
When considering the price impact of bitcoin halving on a four-yearly basis, a step mechanism needs to be included in the extrapolation to reflect the impact of each event on BTC.
Between now and 2030, two halving events will occur, one in May 2024 and the second in May 2028.
Looking at the historical halving events,
First Halving – November 28, 2012 – BTC surged from $12 to a November 28, 2013, high of $1,050 (+8,650%).
Second Halving – July 9, 2016 – BTC surged from $664 to a July 9, 2017, high of $2,556 (+285%).
Third Halving – May 11, 2020 – BTC surged from $8,721 to a May 11, 2021, high of $55,831 (+540%).
Based on the above, bitcoin has surged by an average of 3,158% in the one year after each halving event. By removing the 2012 anomaly, the average increase is 412.5%.
Using the extrapolation from January 2017 to an extrapolated May 2024 projected price of $108,000 and incorporating a 1-year price increase of 413% between May 2024 and May 2025, BTC could hit $446,000.
Incorporating the estimated 413% increase between May 2028 and May 2029, BTC would be on target to hit $2.08 million by May 2029, giving BTC a January 2030 value of $2.11 million.

The projection considers the following assumptions:
-
Bitcoin mining support remains firm.
-
Crypto market regulatory framework supports innovation and the evolution of cryptos as an alternative asset class.
-
Bitcoin Whales numbers hold steady while increasing bitcoin holdings.
-
Crypto asset adoption continues to grow at current rates.
-
There is no catastrophic crypto market event.
Upward Trend in Bitcoin Whale Numbers Support Bullish Projections
Over the years, Bitcoin Whales have been the key to the sustainability of bitcoin and the broader market.
Prominent companies are also among the largest hodlers of bitcoin, including MicroStrategy Inc (MSTR), Tesla (TSLA), and Block Inc (SQ).
An increasing number of Bitcoin Whales favor the more hawkish price projections floating around the crypto market.
Two reasons for this include,
-
A higher number of Bitcoin Whales holding more BTC means lower BTC supply. Stable or increasing demand supports a continued upward trend in BTC price.
-
Bitcoin Whales provide investor comfort by providing price support and strength in numbers. Whales deliver price support by not flooding the market with BTC during bearish trends.
Therefore, the downside support and continued upward trends support the loftier projections, which aren’t as unreasonable as the more skeptical investor may suggest.
This article was originally posted on FX Empire


