U.S. Money Supply Hasn’t Done This Since the Great Depression, and It Usually Signals a Big Move to Come in Stocks
Over multiple decades, Wall Street is a surefire wealth creator. When compared to the annualized returns of housing, gold, oil, and even bonds, the stock market easily has these asset classes beat over long periods.
But things get a bit dicey when the lens is narrowed and investors examine the performance of the broader market over a couple of years or a few months. Since this decade began, the ageless Dow Jones Industrial Average (DJINDICES: ^DJI), benchmark S&P 500 (SNPINDEX: ^GSPC), and growth-driven Nasdaq Composite (NASDAQINDEX: ^IXIC) have alternated between bear and bull markets in successive years. This volatility has investors wondering what’s next for the stock market.


There’s no such thing as a foolproof predictive indicator or metric that can, with 100% accuracy, forecast directional moves in the Dow Jones, S&P 500, and Nasdaq Composite. But there is a select group of datapoints that have exceptionally accurate track records of correlating with big moves in stocks.
One such metric that should have the full attention of Wall Street and investors at the moment is U.S. money supply.
U.S. money supply hasn’t done this since 1933
While there are a handful of money supply measures, M1 and M2 are the two that economists tend to focus on the most.
M1 money supply encompasses cash and coins in circulation, as well as demand deposits in a checking account. Think of M1 as easily accessible money that can be spent at a moment’s notice. M2 accounts for everything in M1 and adds in savings accounts, money market accounts, and certificates of deposit (CDs) below $100,000. It’s money people can still get to with relative ease, but it requires a bit more work to be spent. It’s this latter category that’s raising eyebrows and ringing alarm bells.
Historically speaking, M2 has risen at a relatively steady pace for more than 150 years. As the U.S. economy grows, more capital is required to facilitate transactions. But in those rare instances where M2 notably declines, trouble has followed.
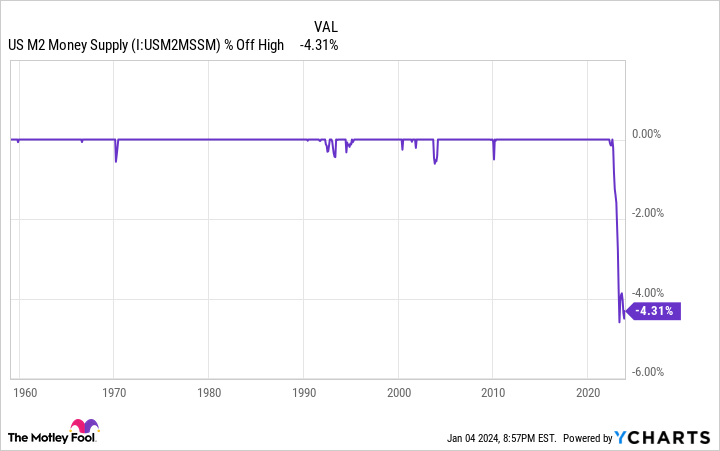
As you can see from the chart above, M2 money supply has dipped from a peak of $21.7 trillion in July 2022 to $20.77 trillion in November 2023. M2 is down a little over 2% on a year-over-year basis and 4.31% from its all-time high set in mid-2022. It’s the first notable drop in M2 money supply since the Great Depression.
Although this is a very modest decline in percentage terms, it’s a very big deal for an economy that’s been dealing with a scorching-hot inflation rate. With the prices for goods and services collectively rising at a faster pace than the Federal Reserve’s long-term target of 2%, more capital will be needed to pay for things. But if M2 is shrinking, it means people and businesses will have to forgo certain purchases. That’s typically a recipe for a recession.
The U.S. economy hasn’t fared well when M2 has notably declined in the past. While there have been a number of times when M2 slipped fractionally when back-tested to 1870, there are only five occasions over the past 154 years where M2 fell by 2% or more on a year-over-year basis: 1878, 1893, 1921, 1931-1933, and the fifth instance is ongoing. The previous four instances all resulted in deflationary depressions for the U.S. economy, along with a sizable increase in the unemployment rate.
WARNING: the Money Supply is officially contracting.
This has only happened 4 previous times in last 150 years.
Each time a Depression with double-digit unemployment rates followed.
pic.twitter.com/j3FE532oac
— Nick Gerli (@nickgerli1) March 8, 2023
To be fair, things have changed considerably with the U.S. economy since the late 19th and early 20th centuries. The Federal Reserve didn’t exist during the depression in 1878 nor the Panic of 1893, and it has a wealth of knowledge on how best to approach downturns compared to the depression in 1921 and the Great Depression. The chance of a depression occurring today is much lower than it was 100 years ago.
At the same time, declines in M2 have historically been a harbinger of economic downturns. Approximately two-thirds of the S&P 500’s drawdowns since the start of the Great Depression in September 1929 have occurred after, not prior to, a recession being declared. In other words, if the U.S. economy shifts into reverse, a pullback or potential bear market for stocks would be the expectation.
M2 isn’t the only money-based metric sounding a warning
I wish I could say that M2 money supply is the only money-based metric that’s currently sounding a warning for Wall Street — but this isn’t the case. Commercial bank credit is another potentially worrisome money-focused datapoint.
Like M2 money supply, commercial bank credit, which encompasses all loans, leases, and securities held by U.S commercial banks, has been trending higher with few exceptions for decades. Since data reporting began in January 1973, commercial bank credit has increased from $567 billion to $17.36 trillion, as of the week ended Dec. 20, 2023. This represents a roughly 7% compound annual growth rate over a half-century.
This increase isn’t surprising. Banks are incented to grow their loan and lease portfolios over time as the U.S. economy expands. But when this steady uptrend in commercial bank credit is interrupted, investors should pay close attention.
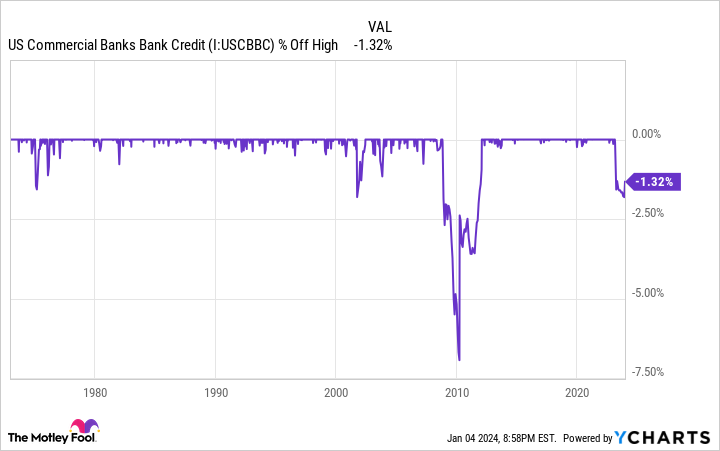
As shown in the chart above, there have been dozens of instances over the past 50 years when commercial bank credit endured minor (less than 1.5%) declines. But there have only been three times in 51 years when commercial bank credit fell by more than 2% from its all-time high:
-
A peak decline of 2.09% at the height of the dot-com bubble in October 2001.
-
A stunning 6.94% tumble following the Great Recession in March 2010.
-
A (thus far) maximum decline of 2.07%, as of November 2023.
What the latest drop in commercial bank credit demonstrates is that financial institutions have tightened their lending standards, which is restricting access to capital for some businesses. It’s akin to depressing the brake on a fast-moving vehicle, and it would be expected to slow corporate earnings growth, or potentially shift it into reverse.
The previous two instances when commercial bank credit fell by at least 2% coincided with the benchmark S&P 500 losing around half of its value.


History is a two-sided coin that strongly favors the patient and optimistic
Based on what some key money-based metrics tell us at the moment, there’s a possibility 2024 could be a challenging year for investors. But investing is all about perspective, and history is a two-sided coin that very much favors those with an optimistic long-term approach.
While we might not like recessions, they’re a perfectly normal and expected part of the economic cycle. Since World War II ended in September 1945, there have been 12 recessions in the United States. Nine of these 12 lasted mere months, while the remaining three failed to surpass 18 months. Conversely, two expansions since World War II endured at least a full decade.
This unevenness between economic expansions and contractions can be seen in the stock market, as well.
Last year, researchers at Bespoke Investment Group released a dataset that examined the average length of bull and bear markets in the S&P 500 since the start of the Great Depression. As shown in the post above, the typical bear market has lasted just 286 calendar days, or 9.5 months. Meanwhile, the average bull market sticks around for 3.5 times as long (1,011 calendar days).
What’s more, there have been 13 S&P 500 bull markets over the last 94 years that endured longer than the lengthiest bear market. If that’s not a ringing endorsement of optimism on Wall Street, I’m not sure what is.
Perhaps the greatest example of using time as an ally comes from an annually updated dataset published by Crestmont Research. The analysts at Crestmont examined the rolling 20-year total returns, including dividends paid, of the S&P 500, dating back to 1900. Even though the S&P didn’t exist until 1923, its components could be found in other major indexes prior to its creation, which allowed researchers to accurately back-test total returns to 1900.
Out of the 104 rolling 20-year periods (1919-2022) Crestmont Research examined, 100% of them yielded a positive total return. Put another way, it doesn’t matter when investors put their money to work in an S&P 500 tracking fund, as long as they (hypothetically) held their positions for 20 years. Regardless of what 2024 has in store for Wall Street, time is investors’ greatest ally.
10 stocks we like better than Walmart
When our analyst team has an investing tip, it can pay to listen. After all, the newsletter they have run for over a decade, Motley Fool Stock Advisor, has tripled the market.*
They just revealed what they believe are the ten best stocks for investors to buy right now… and Walmart wasn’t one of them! That’s right — they think these 10 stocks are even better buys.
*Stock Advisor returns as of 12/18/2023
Sean Williams has no position in any of the stocks mentioned. The Motley Fool has no position in any of the stocks mentioned. The Motley Fool has a disclosure policy.
U.S. Money Supply Hasn’t Done This Since the Great Depression, and It Usually Signals a Big Move to Come in Stocks was originally published by The Motley Fool


