Inflation scare? The stocks that perform best — and worst — when prices rise
What some analysts have dubbed the biggest inflation scare in 40 years has arrived, sending stock-market investors back to the history books for a look at what does and doesn’t work when prices are rising.
Some of the findings are intuitive: Stocks of companies more closely tied to the economic cycle and that are best suited to passing on price increases, preserving their margins, can thrive during periods of rising inflation.
Companies more sensitive to interest rates, which get pushed up as inflation expectations mount, are seen as more likely to suffer, at least relative to their more cyclical counterparts. Overall, stocks are a “real asset,” which means that all else being equal, they should rise as inflation picks up. But performance ultimately may depend on the broader economic context around rising prices.
See: ‘Good’ inflation or ‘bad’? Investors are scared because they can’t tell the difference just yet
Brian Belski, chief investment strategist at BMO Capital Markets, took a detailed look in a Thursday note at the sectors and industries that have historically performed best — and worst — during periods when inflation was behaving much like it is now.
To do so, Belski and his team looked beyond year-over-year movements in the consumer-price index, instead focusing on stock-market performance in relation to the difference between the year-over-year change in the producer-price index for final demand goods and the year-over-year change in the headline CPI reading.
The approach captures a “more notable trend” that has seen the PPI rising at a faster clip year-over-year than CPI for three straight months, he said.
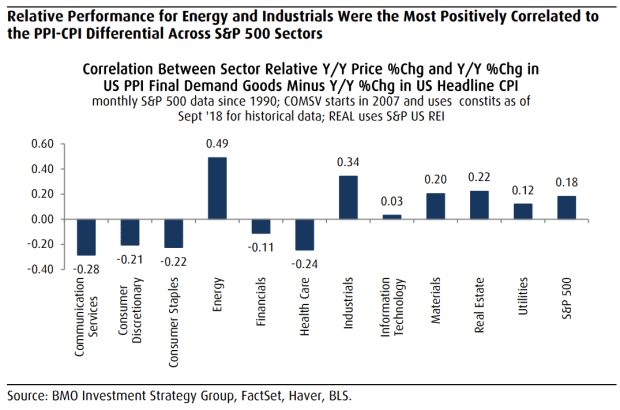
That means the analysts first took the difference between the year-over-year percentage change in PPI for final demand goods and the year-over-year changes in CPI. Then they correlated it with year-over-year percentage price changes for S&P 500 sectors and industry groups. The chart below shows what they found at the sector level:

As the chart shows, the S&P 500 overall has a positive correlation with the differential of 0.18. Among the index’s 12 sectors, energy (0.49) and industrials (0.34) are the most positively correlated, while communication services (-0.28), healthcare (-0.24), and consumer discretionary (-0.21) are the most negatively correlated.
Correlation measures the strength of a relationship between two variables. A positive correlation of 1.0 would mean they move the same direction in lockstep, while a correlation of -1.0 would mean they move equally in opposite directions. A correlation of 0 means there is no statistical relationship.
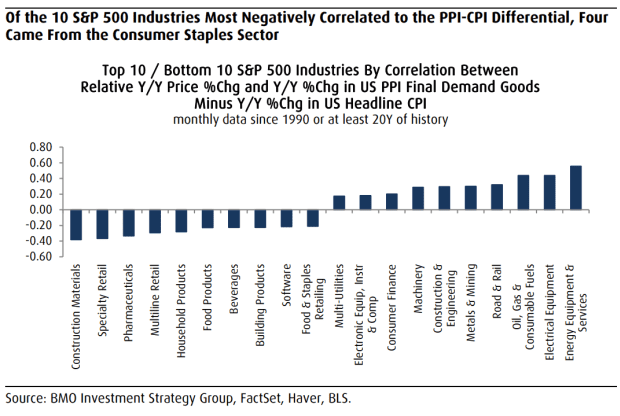
Belski and company further broke the analysis down to the industry level, as shown in the chart below:

Inflation jitters moved front and center earlier this month when the April consumer-price index showed a hotter-than-expected year-over-year jump of 4.2%, sparking a volatile stretch for the stock market and pressuring tech-related shares and other so-called growth stocks.
For the month, the tech-heavy Nasdaq Composite COMP,
Among S&P 500 sectors, energy is up 5.7% in May, while materials are up 4.7%, financials are 3.7% higher and industrials are up 1.1%.
For his part, Belski isn’t convinced that the recent surge in inflation — marked by an April consumer-price index year-over-year jump of 4.2% — will translate into a prolonged period of elevated inflation. Contrary to market angst, and some high-profile investors and academics, he also doesn’t see the Fed risking a policy mistake by refusing to pull forward its timeline on tapering asset purchases and delivering rate hikes.
But it isn’t just investors talking about inflation, Belski noted. Earnings calls for first-quarter results by S&P 500 companies saw the most mentions of “inflation” in more than 10 years, he said, all making it a topic worthy of discussion and research.


