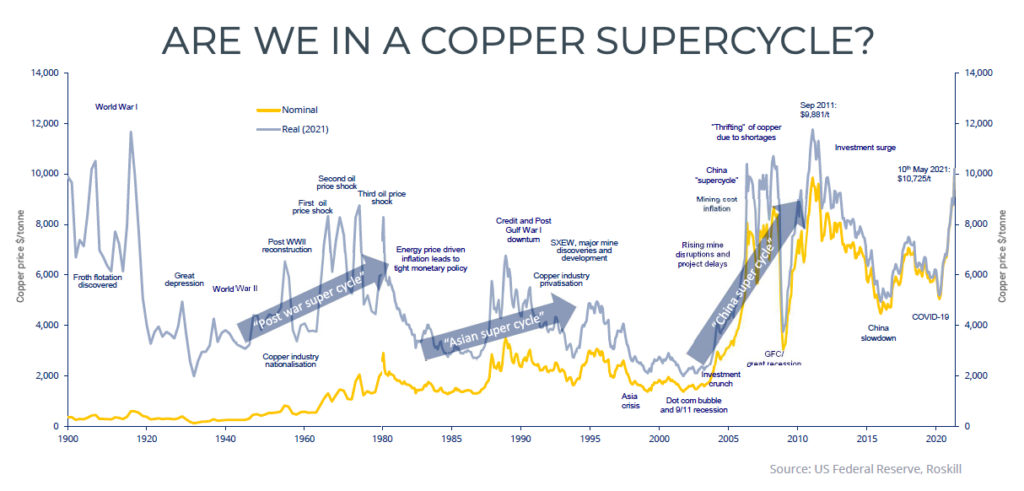
120 year chart shows copper price supercycle only starting
Copper and mining’s central role in the green energy transition has been well documented and as BMO’s Colin Hamilton put it with exquisite understatement in a recent report:
“Copper has rarely been a market short in confidence about future fundamentals.”
With the demand picture going from rosy to crimson, the bulls have seized upon long-standing issues around copper supply to buttress their arguments.
Falling ore grades (G&R has a convincing argument that porphyries, responsible for 80% of global supply, are nearing a reserves cliff), decades of underinvestment in exploration and development, and the vexing role of scrap have underpinned price expectations for a long time.
Voodoo Chile, Perumania, copperbelt tightening
To these factors, add the spectre of an unfavourable investment environment – to put it mildly – in Chile under a new constitution and left-leaning government. Goldman says some 1 million tonnes of future supply from the country could be in danger.
In Peru, the lurch leftward could make Chile’s proposed 75% royalty rates at today’s copper price look market friendly. If the frontrunner in presidential elections promises not to nationalize mines but would rather negotiate, you know how far the goalposts have shifted.
The Democratic Republic of Congo (DRC) has gone from 96,000 tonnes in 2007 to 1.3 million tonnes last year, and thanks to Ivanhoe and Zijin’s Kamoa-Kakula and greenfields like Deziwa, will soon overtake China as the no. 3 producer (that is if you don’t consider the DRC a de-facto mining province of China).
Inspired by Indonesia’s success with raw nickel bans, the central African nation reinstated its concentrate export waiver system, creating another choke point in an already tight global supply chain.
Zambia, closing in on 1mtpa, cannot be far behind.
Crude but effective
Imagine if these resource nationalism developments in copper were happening in global oil markets; where would crude be trading now?
It’s worth repeating that Chile is not the Saudi Arabia of copper, it’s the Saudi-Iran-Iraq-Emirates of copper. And Peru the Russia. And Congo, Nigeria and Angola combined.
And it’s not as if oil workers in Saudi Arabia are wont to strike or local communities regularly blockade oilfields in Russia or that offshore rigs can be swarmed by artisanal diggers.
(And just to draw that analogy out a bit further, the irony of course is that copper is the metal that’ll rid us of fossil fuels.)
All of which makes a purported White House policy of relying on other countries to supply metals to the US because “it’s not that hard to dig a hole. What’s hard is getting that stuff out and getting it to processing facilities,” seem particularly short-sighted.
But that’s a story for another day, perhaps for 2022 or 2024.
Froth floatation
Roskill attempted to answer the question ‘is copper entering a new supercycle?’ with a virtual copper summit last week.
Neal Brewster, chief economist at the fast-growing metals and chemicals research firm headquartered in London, presented a graph that puts copper’s current rally in perspective. A 120-year long perspective.
The chart not only shows some correlation between copper and oil prices and with it broader inflation, but also with nationalization and privatization trends for natural resource assets through the decades.
Bears’ most convincing argument that the copper market is already too frothy, is a slowdown in China as Beijing withdraws post-pandemic stimulus and steers its economy away from breakneck fixed investment-led growth in copper intensive sectors like the electrical grid, housing and transport.
Even in a similar scenario to the one that terminated the most recent supercycle where weakening Chinese demand conspired with an investment surge in new supply, the graph suggests the rally may have legs for a few years yet.
And on top of that in real terms copper has traded higher than today during at least five periods.
Click on chart for full size image


