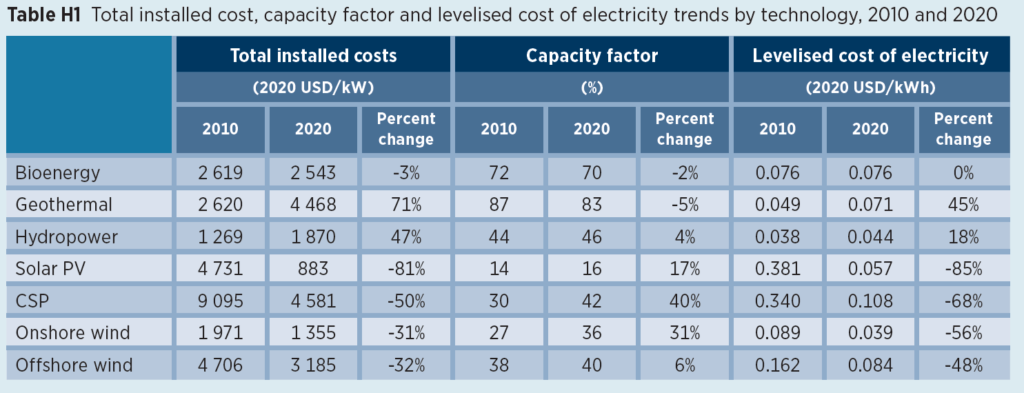
The agency’s review shows that in 2020, a total of 162 GW of the renewable power generation capacity added had electricity costs lower than the cheapest source of new fossil fuel‑fired capacity. This was around 62% of total net capacity additions that year.
“In emerging economies, where electricity demand is growing and new capacity is needed, these renewable power generation projects will reduce costs in the electricity sector by at least $6 billion per year, relative to the cost of adding the same amount of fossil fuel‑fired generation,” the report reads.

The organization’s figures also show that since 2010, a cumulative total of 644 GW of renewable power generation capacity has been added globally with estimated costs that have been lower than the cheapest fossil fuel-fired option in their respective year. Prior to 2016, almost all of this was being contributed by hydropower, but since then it has increasingly included onshore wind and solar PV.
“Of the total, over the decade, 534 GW was added in emerging economies and could reduce electricity system costs in these by up to $32 billion in 2021 ($920 billion, undiscounted, over their economic lifetimes),” the document states.
IRENA also looked at the results of competitive procurement of renewables through auctions or power purchase agreements and concluded that utility-scale solar PV projects that have won recent competitive procurement processes – and that will be commissioned in 2022 – could have an average price of $0.04/kWh, which is a 30% reduction compared to the global weighted-average levelized cost of electricity (LCOE) of solar PV in 2020 and is around 27% less ($0.015/kWh) than the cheapest fossil-fuel competitor, namely coal-fired plants.
The data also suggest that there is an increasing number of projects with very low electricity costs, at below $0.03/kWh.
“Indeed, the last 18 months have seen three record-low bids for solar PV, starting with $0.0157/kWh in Qatar, $0.0135/kWh in the United Arab Emirates and $0.0104/kWh in Saudi Arabia,” the report reads. “Surprisingly, values below $0.02/kWh are not impossible, even if they were unthinkable, even a few years ago. They do, however, require almost all factors affecting LCOE to be at their ‘best’ values.”

In the agency’s view, these very low solar PV price levels may imply that low-cost renewable hydrogen – a proposal Australia’s Fortescue is working on– may already be in reach.
“The potential levelized cost of hydrogen, assuming the low solar PV and onshore wind prices from the recent auctions in Saudi Arabia, could be as little as $1.62/kilogramme of hydrogen (kg H2). This compares favourably with the hypothetical cost of natural gas steam methane reforming, with today’s carbon capture, utilization and storage costs at between $1.45/kg H2 and $2.4/kg H2.”
When it comes to offshore wind costs, the auction and PPA data suggest they will fall within the range of $0.05/kWh to $0.10/kWh in Europe in the period up to 2023, with new markets or delayed projects likely having higher costs.
IRENA says that the lower end of the cost range for offshore wind suggests projects will be competitive against wholesale electricity prices in a number of European markets.
For CSP, on the other hand, the market is thin but the data lean towards a continued decline in 2021, as this year sees the large Dubai Electricity and Water CSP project come online.
“The data from the IRENA Renewable Cost Database and Auction and PPA Database, therefore, highlight the fact that utility-scale solar PV and onshore wind projects are, on average, able to produce power for less than the cheapest new fossil fuel-fired cost project. For offshore wind and CSP, costs will fall into the lower range for new fossil fuel-fired power plants,” the document points out.
Coal becomes more expensive
The review presented by the International Renewable Energy Agency states that as costs for solar PV and onshore wind have fallen, new renewable capacity is not only increasingly cheaper than new fossil fuel‑fired capacity but undercuts the operating costs alone of existing coal‑fired power plants.
IRENA’s numbers show that at least in Europe in 2021, coal-fired power plant operating costs are well above the costs of new solar PV and onshore wind (including the cost of CO2 prices).
Looking at analyses for Germany and Bulgaria, the agency noted that some coal-fired plants have higher operating costs today than new solar PV and onshore wind. In the United States and India, operating costs for coal plants are lower, however, due largely to the absence of a meaningful price for CO2.
“Nonetheless, the majority of existing Indian and US coal plants have higher costs than solar PV and onshore wind, due to the very competitive costs for those two renewable technologies in those two countries,” the report reads. “In the United States, in 2021, between 77% and 91% of the existing coal‑fired capacity has operating costs that are estimated to be higher than the cost of new solar or wind power capacity, while in India, the figure is between 87% and 91%.”
The agency’s information estimates that adjusted to a levelized cost basis, the weighted average price from auction and power purchase agreements for solar PV in India for 2021 is $0.033/kWh, while for onshore wind it is $0.032/kWh. In the United States, the respective figures are $0.031/kWh and $0.037/kWh.
Covid-19 had no impact on cost reduction
Despite the economic slowdown caused by the covid-19 pandemic, the cost for solar and wind power continued to decline in 2020.
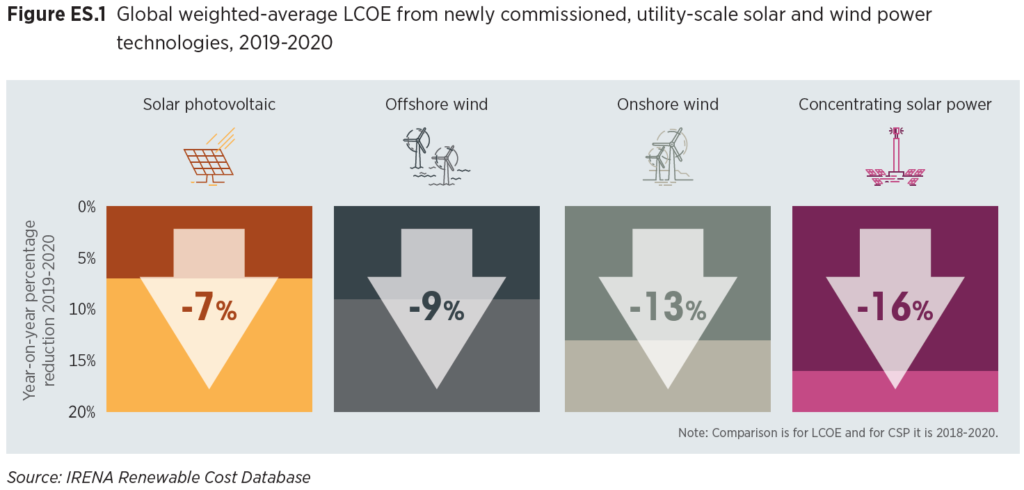
According to IRENA, the global weighted-average levelized cost of electricity from new capacity additions of onshore wind declined by 13% in 2020, compared to 2019. Over the same period, the LCOE of offshore wind fell by 9% and that of utility-scale solar photovoltaics by 7%.
In detail, global weighted-average onshore wind LCOE went from $0.045/kWh to $0.039/kWh, a decline that was driven by a 9% fall in the global weighted-average total installed cost, as China – which has lower than average installed costs – connected an estimated 69 GW to the grid in 2020, two-thirds of the new capacity deployed last year.
The global weighted-average levelized cost of electricity from new capacity additions of onshore wind declined by 13% in 2020, compared to 2019, while the LCOE of offshore wind fell by 9% and that of utility-scale solar photovoltaics by 7%
Global weighted-average LCOE of offshore wind in 2020 saw the global weighted‑average cost of electricity of new projects fall from $0.093/kWh to $0.084/kWh. This was a sharper decline than that experienced in 2019, as China – which has lower than average installed costs – increased its share of new capacity additions, from around one-third in 2019 to around half in 2020.
Utility‑scale solar PV, on the other hand, went from $0.061/kWh to $0.057/kWh, a 7% decline that, however, lower than the 13% decline experienced in 2019. In 2020, too, the global weighted-average total installed cost of utility-scale solar PV fell by 12%, to $883/kW.
According to IRENA, the decline in LCOE terms for utility-scale solar PV was lower than it otherwise might have been, as the decline in total installed costs experienced was partially offset by a reduction in the global weighted‑average capacity factor of new projects in that year. This was driven by deployment in 2020 that was, on balance, weighted towards areas with poorer solar resources than those seeing deployment in 2019. Similar to the situation for onshore wind, China was the largest market for new capacity, accounting for an estimated 45% of the new, utility‑scale capacity added in 2020.
The agency also reported that the global weighted‑average LCOE of new, concentrating solar power projects commissioned in 2020 fell by 49%, year‑on‑year. In the organization’s view, this result is atypical as the global weighted‑average LCOE in 2019 was pushed up by Israeli projects, while 2020 was characterized by the commissioning of just two plants, both in China.
“Looking at the figures between 2018 and 2020 reveals a compound annual rate of decline of 16% per year, which is more representative of recent rates of cost reduction,” the review states.


