Facebook-parent Meta’s stock bounces after chart flashed most oversold reading in a decade
Shares of Facebook-parent Meta Platforms Inc. bounced off a 20-month low Wednesday, as a widely followed technical indicator sank to the most oversold level seen since just a few months after the company went public 10 years ago.
The stock FB,
The bounce comes as part of a broad rally in the technology sector, and after the stock closed Tuesday at the lowest price since June 2020, to take it 42.4% below its Sept. 7, 2021 record close of $382.18. Also on Tuesday, the stock’s Relative Strength Index (RSI) closed at 21.52, the lowest level since the record-low close of 18.13 on Aug. 2, 2012.
The RSI ended Wednesday at 28.20.

The RSI is a momentum indicator that measures the magnitude of stock price gains, typically over the past 14 sessions, against the magnitude of losses. Many chart watchers view readings below 30.00 as a sign of oversold conditions. Read more about the RSI indicator.

Keep in mind that the RSI is not necessarily a good market-timing tool, as oversold conditions can last for relatively long periods. And some even see oversold conditions as a sign of a stock’s underlying weakness, in that the ability to become oversold confirms the strength of a downtrend.
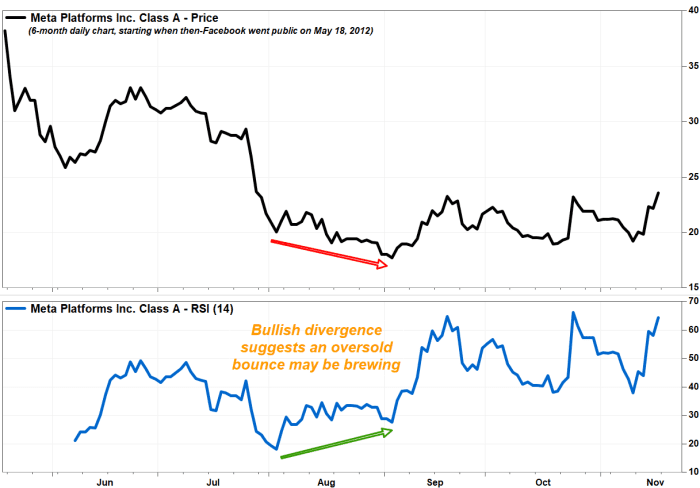
For example, when Meta, then called Facebook, saw its RSI hit its low on Aug. 2, 2012, which was less than three months after the social media company went public, the stock closed at $20.04, or 47.3% below the $38 initial-public-offering price.
The stock didn’t bottom till a month later, after a further 11.5% drop to $17.73 on Sept. 4. The RSI closed that day at 27.64.
The idea is to wait for a “bullish divergence,” in which the stock keeps falling but the RSI has started rising, for a sign that the stock may be ready to launch an oversold bounce, like what happened in August 2012:

Meta’s stock has dropped 14.7% over the past 12 months, while the S&P 500 index SPX,


