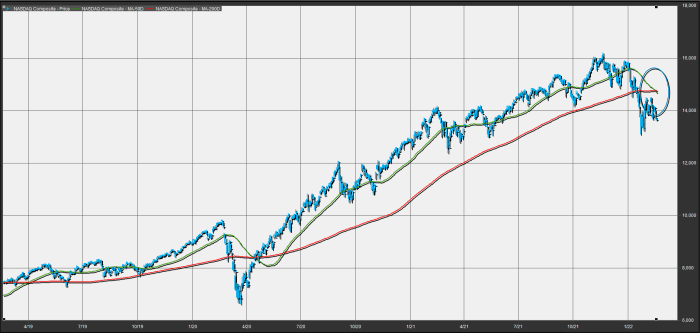
Death cross crystallizes in Nasdaq Composite on Friday for first time in 2 years, in a bearish sign for the stock market
The Nasdaq Composite index has produced a “death cross” chart pattern on Friday, a bearish chart pattern for an asset.
History suggests this occurrence could weigh on the broader stock market over the shorter term, however, it is unclear if the formation of the downbeat pattern, closely followed by market technicians, signals more pain ahead or simply affirms a downtrend that has taken shape in markets.
A death cross appears when the 50-day moving average crosses below the 200-day moving average, an event that many chart watchers view as marking the spot a shorter-term correction morphs into a longer-term downtrend.
At last check, the Nasdaq Composite’s COMP,

The last time a death cross formed in the Nasdaq Composite was April 16, 2020, according to Dow Jones Market Data.
It is worth noting that such crosses aren’t necessarily good market-timing indicators, however, as they are well telegraphed, but they can help put a selloff in historical perspective, technicians say.
U.S. stocks, and specifically once-highflying technology stocks, have been buffeted by expectations of a new regime of higher interest rates to be ushered in by the Federal Reserve as it combats surging inflation.
Concerns about military conflict in Europe also have provoked anxieties among bullish investors and driven down the value in stocks in speculative and yield-sensitive areas of the market, which makes up a large chunk of the Nasdaq Composite constituents.
On Friday, stocks were trading slightly higher, with the Nasdaq Composite up 0.1%, while the S&P 500 index SPX,
Neither the Dow nor the S&P 500 are close to seeing death crosses. However, a death cross materialized in the small-capitalization oriented Russell 2000 index RUT,
—Tomi Kilgore contributed to this article


