Cardano (ADA) Sees Red but Likely to Resume Upward Trend
Key Insights:
-
Cardano (ADA) slid by 3.01% on Friday, reversing a 2.08% gain from Thursday.
-
Cardano network updates remain ADA price positive
-
Technical indicators are bullish, with ADA sitting well above the 50-day EMA.
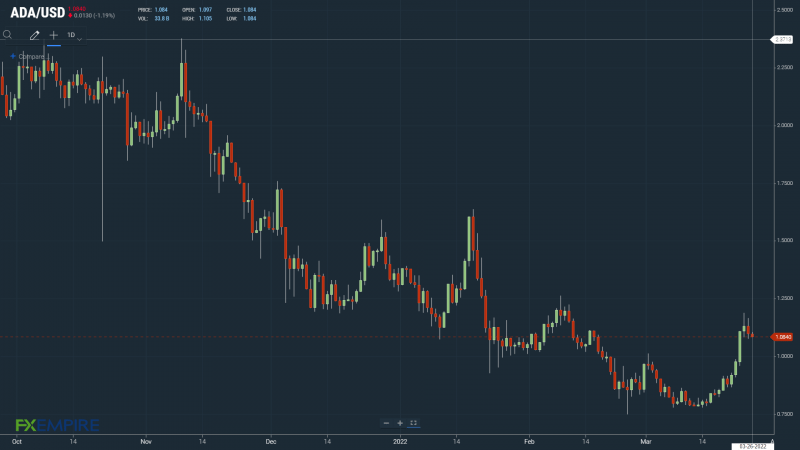
It was a bearish session for Cardano (ADA) on Friday. A pullback across the broader crypto market left ADA in the red.
Reversing a 2.08% gain from Thursday, ADA fell by 3.01% to end the day at $1.097. Avoiding sub-$1.00 levels was the key on the day, with a fall to a day low of $1.075 testing the First Major Support level at $1.0783.
Network News Updates Remain ADA Positive
For ADA, network updates continue to support a bullish outlook. This week, Input Output HK (IOHK) provided price support. On Monday, the Cardano developer announced an upgrade to address scaling on the network.
This year, successfully delivering on the Cardano scaling roadmap would support the rapid growth of Cardano’s DeFi ecosystem. In 2021, IOHK delivered smart contract capability, which was the prelude to addressing scaling that would support a surge in DeFi platforms. All of this would translate into greater demand for ADA, with DeFi enabling users to buy, sell, borrow, lend, and swap ADA against the respective exchange tokens.
ADA Price Action
At the time of writing, ADA was down 1.19% to $1.084. A bullish start to the day saw ADA strike an early high of $1.105 before falling to a low of $1.084.

Technical Indicators
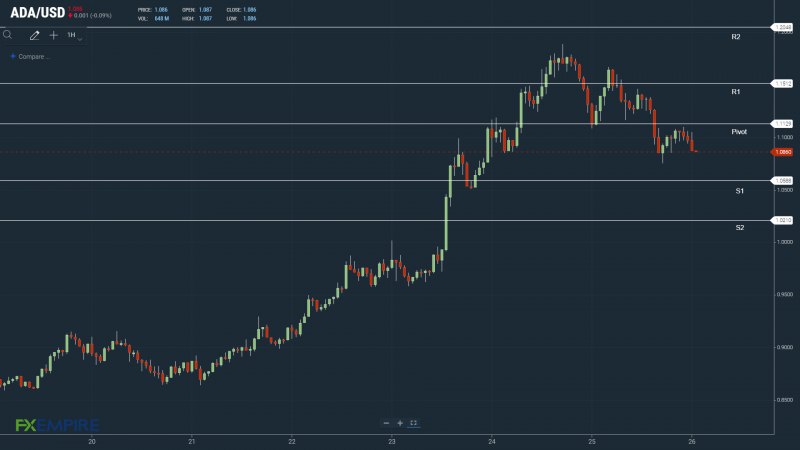
ADA will need to move through the day’s $1.1130 pivot to make another run on the First Major Resistance Level at $1.1510. ADA would need the broader crypto market to support a move back through to $1.10.
An extended rally would test the Second Major Resistance Level at $1.2050. The Third Major Resistance Level sits at $1.2970.
Failure to move through the pivot would test the First Major Support Level at $1.0590. Barring an extended sell-off, ADA should avoid a return to sub-$1.00. The Second Major Support Level at $1.0210 should limit the downside.

Looking at the EMAs and the 4-hourly candlestick chart (above), it is a bullish signal. ADA holds above the 50-day EMA at $0.9978. Following Friday’s bullish cross of the 100-day EMA through the 200-day EMA, the 50-day EMA continues to pull away from the 200-day EMA.
The 100-day has also pulled away from the 200-day EMA, ADA price positive.
Avoiding the 50-day EMA and a return to $1.10 levels would bring $1.20 into play.

This article was originally posted on FX Empire


